OPEN-SOURCE SCRIPT
已更新 Ultra Volume Detector
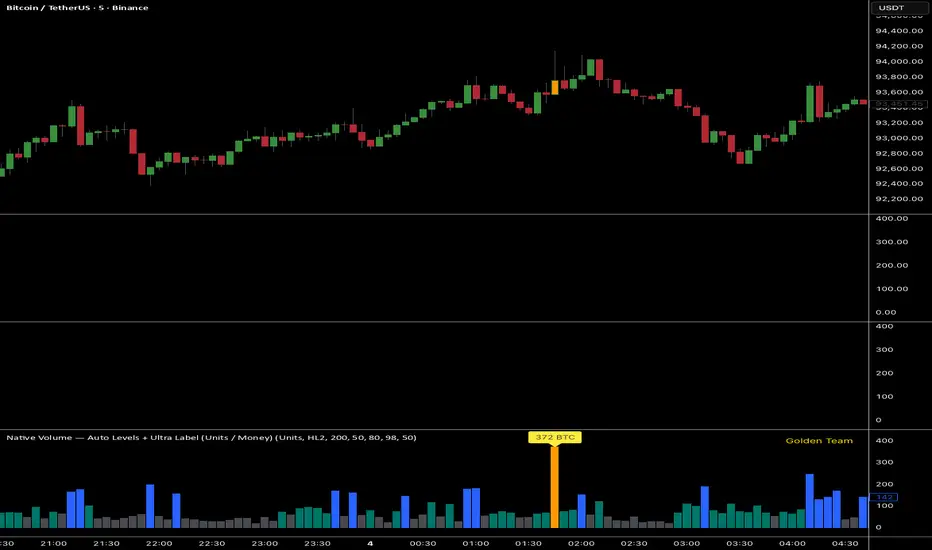
Native Volume — Auto Levels + Ultra Label
What it does
This indicator classifies volume bars into four categories — Low, Medium, High, and Ultra — using rolling percentile thresholds. Instead of fixed cutoffs, it adapts dynamically to recent market activity, making it useful across different symbols and timeframes. Ultra-high volume bars are highlighted with labels showing compacted values (K/M/B/T) and the appropriate unit (shares, contracts, ticks, etc.).
Core Logic
Dynamic thresholds: Calculates percentile levels (e.g., 50th, 80th, 98th) over a user-defined window of bars.
Categorization: Bars are colored by category (Low/Med/High/Ultra).
Ultra labeling: Only Ultra bars are labeled, preventing chart clutter.
Optional MA: A moving average of raw volume can be plotted for context.
Alerts: Supports both alert condition for Ultra events and dynamic alert() messages that include the actual volume value at bar close.
How to use
Adjust window size: Larger windows (e.g., 200+) provide stable thresholds; smaller windows react more quickly.
Set percentiles: Typical defaults are 50 for Medium, 80 for High, and 98 for Ultra. Lower the Ultra percentile to see more frequent signals, or raise it to isolate only extreme events.
Read chart signals:
Bar colors show the category.
Labels appear only on Ultra bars.
Alerts can be set up for automatic notification when Ultra volume occurs.
Why it’s unique
Adaptive: Uses rolling statistics, not static thresholds.
Cross-asset ready: Adjusts units automatically depending on instrument type.
Efficient visualization: Focuses labels only on the most significant events, reducing noise.
⚠️ Disclaimer: This tool is for educational and analytical purposes only. It does not provide financial advice. Always test and manage risk before trading live
版本注释
add money volume版本注释
add candle color开源脚本
秉承TradingView的精神,该脚本的作者将其开源,以便交易者可以查看和验证其功能。向作者致敬!您可以免费使用该脚本,但请记住,重新发布代码须遵守我们的网站规则。
免责声明
这些信息和出版物并非旨在提供,也不构成TradingView提供或认可的任何形式的财务、投资、交易或其他类型的建议或推荐。请阅读使用条款了解更多信息。
开源脚本
秉承TradingView的精神,该脚本的作者将其开源,以便交易者可以查看和验证其功能。向作者致敬!您可以免费使用该脚本,但请记住,重新发布代码须遵守我们的网站规则。
免责声明
这些信息和出版物并非旨在提供,也不构成TradingView提供或认可的任何形式的财务、投资、交易或其他类型的建议或推荐。请阅读使用条款了解更多信息。