OPEN-SOURCE SCRIPT
Bullish Breakout After Consolidation
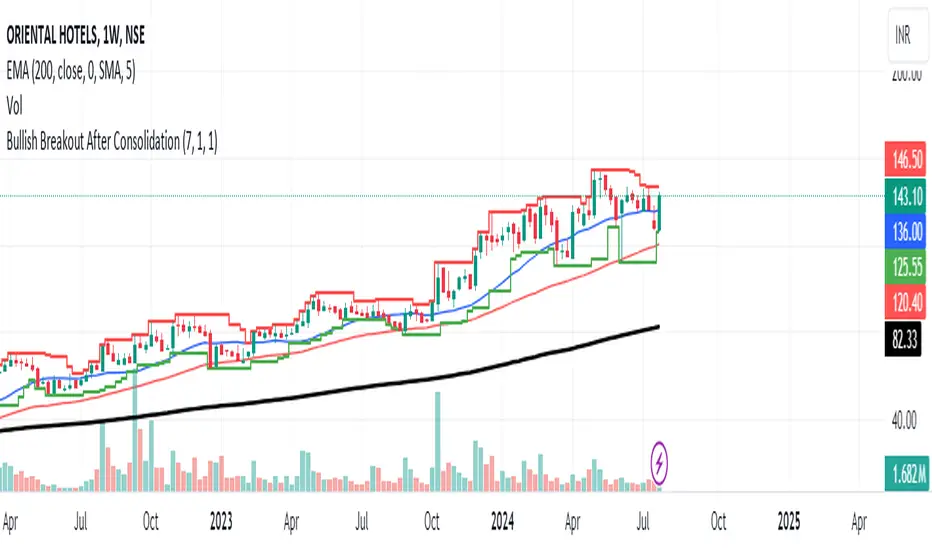
Description:
The Bullish Breakout After Consolidation Indicator is designed to help traders identify potential bullish breakout opportunities following a period of tight price consolidation. This indicator combines price action and volume analysis to signal when a stock may experience a significant upward movement.
Features:
Consolidation Range Tightness: The indicator identifies periods where the stock price consolidates within a narrow range, defined as a range less than 2% of the lowest low during the consolidation period. This tight consolidation is often a precursor to strong price movements.
Breakout Detection: Once the price breaks above the highest high of the consolidation range, and this breakout occurs after a specified number of days post-consolidation, the indicator marks it as a potential breakout opportunity.
Volume Confirmation: To avoid false breakouts, the indicator requires increased trading volume during the breakout. This ensures that the breakout is supported by substantial market activity.
Visual Cues:
Breakout Label: A "Breakout" label appears above the bar where a valid breakout occurs, making it easy to spot potential entry points.
Support and Resistance Lines: Horizontal lines plot the highest high (resistance) and lowest low (support) during the consolidation period, helping traders visualize the breakout levels.
Moving Averages: Optional 20-day and 50-day simple moving averages are plotted for additional trend confirmation.
How to Use:
Apply the Indicator: Add the indicator to your chart in TradingView to start analyzing potential breakouts.
Observe Consolidation: Look for tight consolidation periods where the price trades within a narrow range.
Identify Breakouts: Watch for breakouts where the price moves above the highest high of the consolidation range, supported by increased volume.
Confirm with Labels: The "Breakout" label will help you quickly identify valid breakout signals.
Parameters:
Consolidation Length: Number of days to consider for consolidation.
Range Percentage: Maximum percentage range for consolidation tightness.
Days After Consolidation: Number of days post-consolidation to check for the breakout.
Note: As with any trading tool, it is important to use this indicator as part of a broader trading strategy and in conjunction with other forms of analysis.
Disclaimer: This indicator is provided for educational purposes and should not be construed as financial advice. Trading involves risk and may not be suitable for all investors.
开源脚本
秉承TradingView的精神,该脚本的作者将其开源,以便交易者可以查看和验证其功能。向作者致敬!您可以免费使用该脚本,但请记住,重新发布代码须遵守我们的网站规则。
免责声明
这些信息和出版物并非旨在提供,也不构成TradingView提供或认可的任何形式的财务、投资、交易或其他类型的建议或推荐。请阅读使用条款了解更多信息。
开源脚本
秉承TradingView的精神,该脚本的作者将其开源,以便交易者可以查看和验证其功能。向作者致敬!您可以免费使用该脚本,但请记住,重新发布代码须遵守我们的网站规则。
免责声明
这些信息和出版物并非旨在提供,也不构成TradingView提供或认可的任何形式的财务、投资、交易或其他类型的建议或推荐。请阅读使用条款了解更多信息。