PROTECTED SOURCE SCRIPT
(EMI 1) Epic Market Indicator v2.2
Had to release a new version, due to house rules.
This indicator is usable for every market and I do suggest to use it in combination with EMI 2.
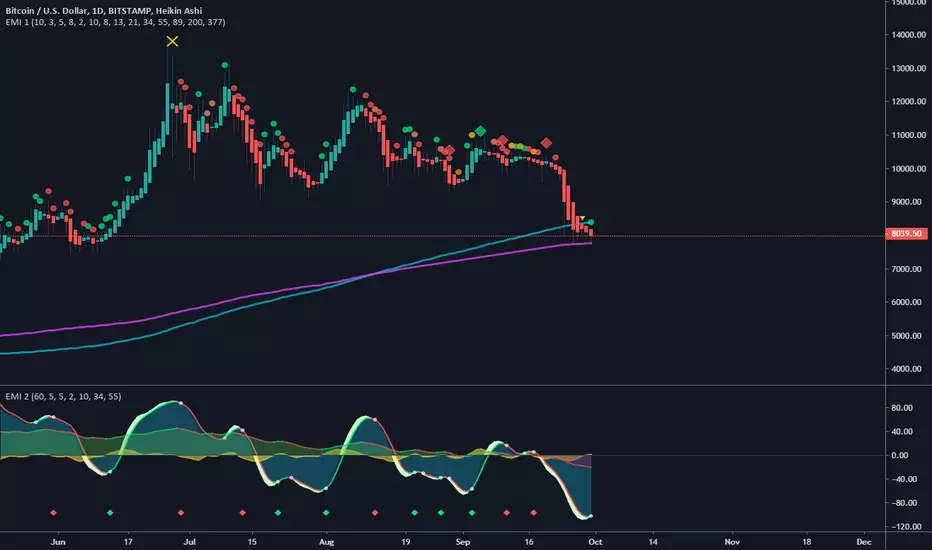
Green = buy/long, Red = sell/short
Orange = Price action divergence/convergence.
Yellow X = Manipulation, you might to be careful when you see this, most of the time dumps happens afterwards.
Always wait for the candle/bar to close and if possible wait for another confirmation. No confirmation most of the time means, trend continuation.
Diamonds are the strongest signal, you might want to to buy/long or sell/short when you see this signals.
Cirles/Dots are trend continuation, shows which way the trend. More of the same color in a row the stronger the prediction. But once you see an orange colored signal then it's possibly going to diverge.
Longer the term/period the more accurate prediction signals will be.
You can enable/disable other tools in the settings:
EMA's, SMA , Bollinger Bands and Pivots .
But also trend colors
Setup your own configurations the way you like. I recommend using Fibonacci seq . Keep in mind, sooner the prediction signals become the more riskier.
update:
- Added bollinger bands with trend color. You can disable or enable this in the settings.
- Modified manipulation conditions.
- Modified buy and sell conditions.
This indicator is usable for every market and I do suggest to use it in combination with EMI 2.
Green = buy/long, Red = sell/short
Orange = Price action divergence/convergence.
Yellow X = Manipulation, you might to be careful when you see this, most of the time dumps happens afterwards.
Always wait for the candle/bar to close and if possible wait for another confirmation. No confirmation most of the time means, trend continuation.
Diamonds are the strongest signal, you might want to to buy/long or sell/short when you see this signals.
Cirles/Dots are trend continuation, shows which way the trend. More of the same color in a row the stronger the prediction. But once you see an orange colored signal then it's possibly going to diverge.
Longer the term/period the more accurate prediction signals will be.
You can enable/disable other tools in the settings:
EMA's, SMA , Bollinger Bands and Pivots .
But also trend colors
Setup your own configurations the way you like. I recommend using Fibonacci seq . Keep in mind, sooner the prediction signals become the more riskier.
update:
- Added bollinger bands with trend color. You can disable or enable this in the settings.
- Modified manipulation conditions.
- Modified buy and sell conditions.
受保护脚本
此脚本以闭源形式发布。 但是,您可以自由使用,没有任何限制 — 了解更多信息这里。
免责声明
这些信息和出版物并非旨在提供,也不构成TradingView提供或认可的任何形式的财务、投资、交易或其他类型的建议或推荐。请阅读使用条款了解更多信息。
免责声明
这些信息和出版物并非旨在提供,也不构成TradingView提供或认可的任何形式的财务、投资、交易或其他类型的建议或推荐。请阅读使用条款了解更多信息。