OPEN-SOURCE SCRIPT
已更新 Turbulence with direction

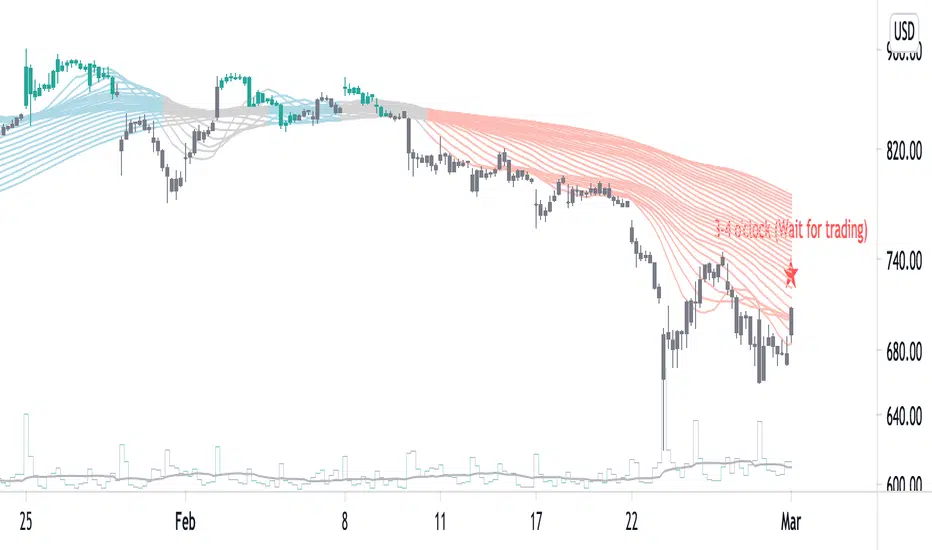
This indicator uses 28 SMA lines from SMA12 to SMA120 with an interval of 4 to reveal the unseen underlying structure that determines the stock price trend. The convergent area of MA lines usually creates support for the stock price. This indicator also includes a clock position for a clear view of the direction of the current trend.
This work is inspired by LoneCapical, Benoit Mandelbrot, and Bill Williams.
MA lines are colored with blue for bullish trends, red for bearish trends, and gray for no apparent direction.
This work is inspired by LoneCapical, Benoit Mandelbrot, and Bill Williams.
MA lines are colored with blue for bullish trends, red for bearish trends, and gray for no apparent direction.
版本注释
This version calculates the slope with the logarithmic price difference and the logarithmic time interval, which provides a more accurate scale on the trend direction.版本注释
Add an input option to turn the trading indication ON or OFF.版本注释
Set the default option to not showing direction.版本注释
Remove typos.开源脚本
秉承TradingView的精神,该脚本的作者将其开源,以便交易者可以查看和验证其功能。向作者致敬!您可以免费使用该脚本,但请记住,重新发布代码须遵守我们的网站规则。
免责声明
这些信息和出版物并非旨在提供,也不构成TradingView提供或认可的任何形式的财务、投资、交易或其他类型的建议或推荐。请阅读使用条款了解更多信息。
开源脚本
秉承TradingView的精神,该脚本的作者将其开源,以便交易者可以查看和验证其功能。向作者致敬!您可以免费使用该脚本,但请记住,重新发布代码须遵守我们的网站规则。
免责声明
这些信息和出版物并非旨在提供,也不构成TradingView提供或认可的任何形式的财务、投资、交易或其他类型的建议或推荐。请阅读使用条款了解更多信息。