OPEN-SOURCE SCRIPT
已更新 Market Movement After Open
Description:
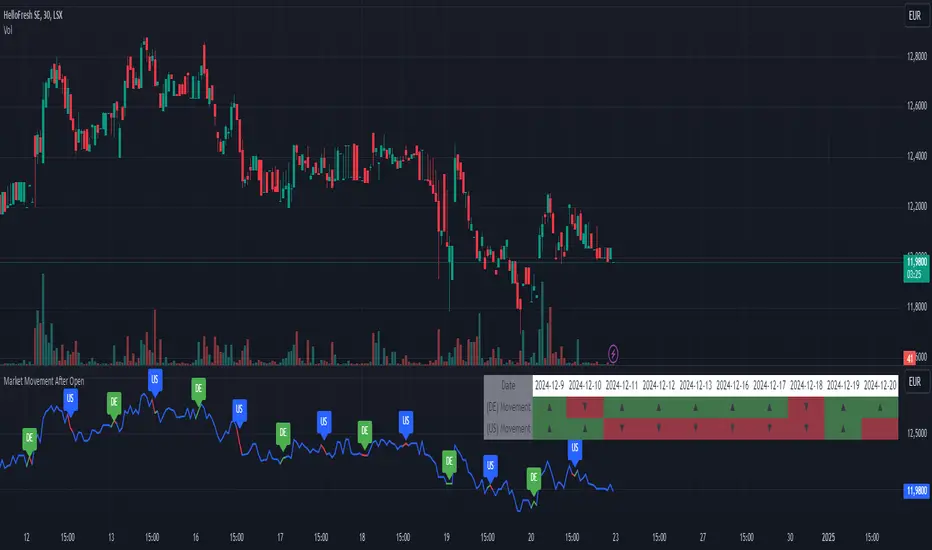
This script provides a detailed visualization of market movements during key trading hours: the German market opening (08:00–09:00 UTC+1) and the US market opening (15:30–16:30 UTC+1). It is designed to help traders analyze price behavior in these critical trading periods by capturing and presenting movement patterns and trends directly on the chart and in an interactive table.
Key Features:
Market Movement Analysis:
Tracks the price movement during the German market's first hour (08:00–09:00 UTC+1) and the US market's opening session (15:30–16:30 UTC+1).
Analyzes whether the price moved up or down during these intervals.
Visual Representation:
Dynamically colored price lines indicate upward (green) or downward (red) movement during the respective periods.
Labels ("DE" for Germany and "US" for the United States) mark key moments in the chart.
Historical Data Table:
Displays the past 10 trading days' movement trends in an interactive table, including:
Date: Trading date.
German Market Movement: Up (▲), Down (▼), or Neutral (-) for 08:00–09:00 UTC+1.
US Market Movement: Up (▲), Down (▼), or Neutral (-) for 15:30–16:30 UTC+1.
The table uses color coding for easy interpretation: green for upward movements, red for downward, and gray for neutral.
Real-Time Updates:
Automatically updates during live trading sessions to reflect the most recent movements.
Highlights incomplete periods (e.g., ongoing sessions) to indicate their status.
Customizable:
Suitable for intraday analysis or broader studies of market trends.
Designed to overlay directly on any price chart.
Use Case:
This script is particularly useful for traders who focus on market openings, which are often characterized by high volatility and significant price movements. By providing a clear visual representation of historical and live data, it aids in understanding and capitalizing on market trends during these critical periods.
Notes:
The script works best when the chart is set to the appropriate timezone (UTC+1 for the German market or your local equivalent).
For precise trading decisions, consider combining this script with other technical indicators or trading strategies.
Feel free to share feedback or suggest additional features to enhance the script!
版本注释
Description:This script provides a detailed visualization of market movements during key trading hours: the German market opening (08:00–09:00 UTC+1) and the US market opening (15:30–16:30 UTC+1). It is designed to help traders analyze price behavior in these critical trading periods by capturing and presenting movement patterns and trends directly on the chart and in an interactive table.
Key Features:
Market Movement Analysis:
Tracks the price movement during the German market's first hour (08:00–09:00 UTC+1) and the US market's opening session (15:30–16:30 UTC+1).
Analyzes whether the price moved up or down during these intervals.
Visual Representation:
Dynamically colored price lines indicate upward (green) or downward (red) movement during the respective periods.
Labels ("DE" for Germany and "US" for the United States) mark key moments in the chart.
Historical Data Table:
Displays the past 10 trading days' movement trends in an interactive table, including:
Date: Trading date.
German Market Movement: Up (▲), Down (▼), or Neutral (-) for 08:00–09:00 UTC+1.
US Market Movement: Up (▲), Down (▼), or Neutral (-) for 15:30–16:30 UTC+1.
The table uses color coding for easy interpretation: green for upward movements, red for downward, and gray for neutral.
Real-Time Updates:
Automatically updates during live trading sessions to reflect the most recent movements.
Highlights incomplete periods (e.g., ongoing sessions) to indicate their status.
Customizable:
Suitable for intraday analysis or broader studies of market trends.
Designed to overlay directly on any price chart.
Use Case:
This script is particularly useful for traders who focus on market openings, which are often characterized by high volatility and significant price movements. By providing a clear visual representation of historical and live data, it aids in understanding and capitalizing on market trends during these critical periods.
Notes:
The script works best when the chart is set to the appropriate timezone (UTC+1 for the German market or your local equivalent).
For precise trading decisions, consider combining this script with other technical indicators or trading strategies.
Feel free to share feedback or suggest additional features to enhance the script!
开源脚本
秉承TradingView的精神,该脚本的作者将其开源,以便交易者可以查看和验证其功能。向作者致敬!您可以免费使用该脚本,但请记住,重新发布代码须遵守我们的网站规则。
免责声明
这些信息和出版物并非旨在提供,也不构成TradingView提供或认可的任何形式的财务、投资、交易或其他类型的建议或推荐。请阅读使用条款了解更多信息。
免责声明
这些信息和出版物并非旨在提供,也不构成TradingView提供或认可的任何形式的财务、投资、交易或其他类型的建议或推荐。请阅读使用条款了解更多信息。