OPEN-SOURCE SCRIPT
EMA and VWAP by Phil Vo
EMA and VWAP by Phil Vo
Description
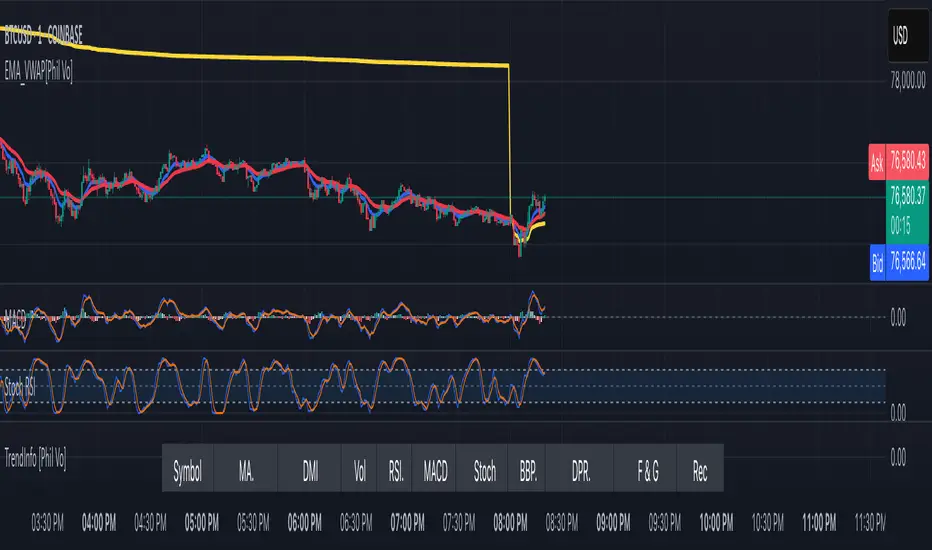
This indicator combines two powerful technical analysis tools: Exponential Moving Averages (EMAs) and Volume Weighted Average Price (VWAP). Designed to assist traders in identifying trends and key price levels, this script overlays two customizable EMAs and a daily VWAP on your chart.
* EMA 1 (Blue): A fast-moving EMA with a default period of 9, ideal for short-term trend analysis.
* EMA 2 (Red): A slower EMA with a default period of 21, useful for confirming longer-term trends.
* VWAP (Yellow): The Volume Weighted Average Price, calculated using the typical price (HLC3) and volume, resetting daily. It serves as a dynamic support/resistance level and reflects the average price weighted by volume.
Features
* Customizable EMAs: Adjust the periods of both EMAs via the settings (minimum period: 1).
* Visual Clarity: Each line is plotted in a distinct color (Blue for EMA 1, Red for EMA 2, Yellow for VWAP) with a linewidth of 2 for easy identification.
* Daily VWAP: The VWAP resets at the start of each trading day, providing a reliable intraday reference point.
* Tooltips: Hover over the input settings to see descriptions of each EMA period.
How to Use
1. Add the indicator to your chart.
2. Customize the EMA periods in the settings if desired (defaults are 9 and 21).
3. Use the EMAs to spot trends:
* When EMA 1 crosses above EMA 2, it may signal a bullish trend.
* When EMA 1 crosses below EMA 2, it may indicate a bearish trend.
4. Use the VWAP as a dynamic support/resistance level:
* Prices above VWAP might suggest bullish momentum.
* Prices below VWAP might indicate bearish pressure.
Settings
* EMA 1 Length: Set the period for the fast EMA (default: 9).
* EMA 2 Length: Set the period for the slow EMA (default: 21).
Notes
* The VWAP resets daily by default, making it most suitable for intraday trading.
* This script is open-source under the Mozilla Public License 2.0, so feel free to study or modify it!
Author
Created by Phil Vo. Happy trading!
How to Add This to TradingView
When you publish the script:
1. Paste the description above into the "Description" field in the "Publish Script" dialog.
2. Set the title as "EMA and VWAP by Phil Vo".
3. Choose "Public" visibility and "Open" access to share it with the community.
4. Add tags like "EMA", "VWAP", "Moving Average", "Trend", and "Volume" to help users find it.
This description provides a clear explanation of the indicator’s purpose, usage instructions, and customization options, making it accessible and helpful for TradingView users. Let me know if you’d like to adjust anything!
Description
This indicator combines two powerful technical analysis tools: Exponential Moving Averages (EMAs) and Volume Weighted Average Price (VWAP). Designed to assist traders in identifying trends and key price levels, this script overlays two customizable EMAs and a daily VWAP on your chart.
* EMA 1 (Blue): A fast-moving EMA with a default period of 9, ideal for short-term trend analysis.
* EMA 2 (Red): A slower EMA with a default period of 21, useful for confirming longer-term trends.
* VWAP (Yellow): The Volume Weighted Average Price, calculated using the typical price (HLC3) and volume, resetting daily. It serves as a dynamic support/resistance level and reflects the average price weighted by volume.
Features
* Customizable EMAs: Adjust the periods of both EMAs via the settings (minimum period: 1).
* Visual Clarity: Each line is plotted in a distinct color (Blue for EMA 1, Red for EMA 2, Yellow for VWAP) with a linewidth of 2 for easy identification.
* Daily VWAP: The VWAP resets at the start of each trading day, providing a reliable intraday reference point.
* Tooltips: Hover over the input settings to see descriptions of each EMA period.
How to Use
1. Add the indicator to your chart.
2. Customize the EMA periods in the settings if desired (defaults are 9 and 21).
3. Use the EMAs to spot trends:
* When EMA 1 crosses above EMA 2, it may signal a bullish trend.
* When EMA 1 crosses below EMA 2, it may indicate a bearish trend.
4. Use the VWAP as a dynamic support/resistance level:
* Prices above VWAP might suggest bullish momentum.
* Prices below VWAP might indicate bearish pressure.
Settings
* EMA 1 Length: Set the period for the fast EMA (default: 9).
* EMA 2 Length: Set the period for the slow EMA (default: 21).
Notes
* The VWAP resets daily by default, making it most suitable for intraday trading.
* This script is open-source under the Mozilla Public License 2.0, so feel free to study or modify it!
Author
Created by Phil Vo. Happy trading!
How to Add This to TradingView
When you publish the script:
1. Paste the description above into the "Description" field in the "Publish Script" dialog.
2. Set the title as "EMA and VWAP by Phil Vo".
3. Choose "Public" visibility and "Open" access to share it with the community.
4. Add tags like "EMA", "VWAP", "Moving Average", "Trend", and "Volume" to help users find it.
This description provides a clear explanation of the indicator’s purpose, usage instructions, and customization options, making it accessible and helpful for TradingView users. Let me know if you’d like to adjust anything!
开源脚本
秉承TradingView的精神,该脚本的作者将其开源,以便交易者可以查看和验证其功能。向作者致敬!您可以免费使用该脚本,但请记住,重新发布代码须遵守我们的网站规则。
免责声明
这些信息和出版物并非旨在提供,也不构成TradingView提供或认可的任何形式的财务、投资、交易或其他类型的建议或推荐。请阅读使用条款了解更多信息。
开源脚本
秉承TradingView的精神,该脚本的作者将其开源,以便交易者可以查看和验证其功能。向作者致敬!您可以免费使用该脚本,但请记住,重新发布代码须遵守我们的网站规则。
免责声明
这些信息和出版物并非旨在提供,也不构成TradingView提供或认可的任何形式的财务、投资、交易或其他类型的建议或推荐。请阅读使用条款了解更多信息。