OPEN-SOURCE SCRIPT
Key Levels: Open & Midday
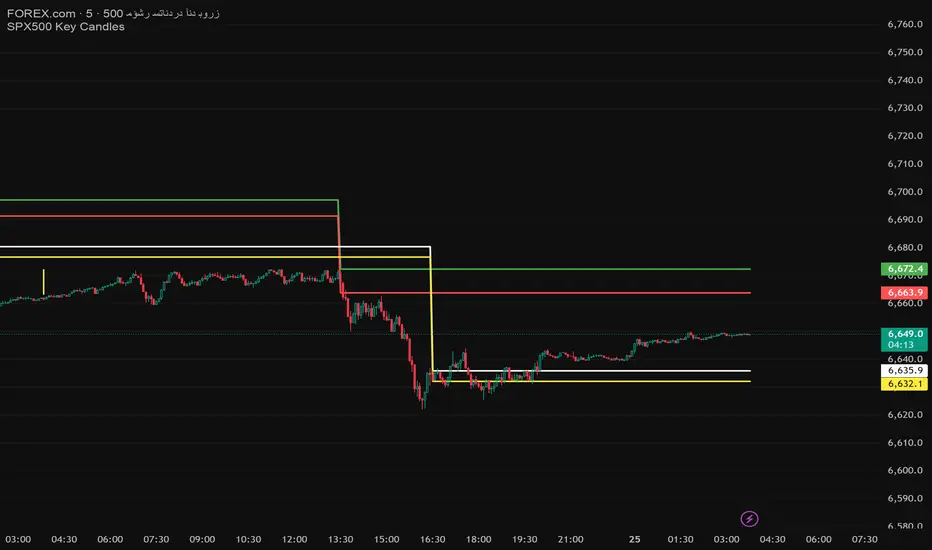
🔹 Opening Candle (9:30 AM New York Time)
Plots the high and low of the first 5-minute candle after the market opens.
🔹 12:30 PM Candle (3 hours after open)
Plots the high and low of the candle formed exactly 3 hours after the market opens.
These levels are useful for:
Identifying support/resistance zones.
Creating breakout or reversal strategies.
Tracking intraday momentum shifts.
📌 Important Notes:
Designed for 5-minute charts.
Make sure your chart is set to New York time (exchange time) for accurate levels.
Happy Trading!
开源脚本
秉承TradingView的精神,该脚本的作者将其开源,以便交易者可以查看和验证其功能。向作者致敬!您可以免费使用该脚本,但请记住,重新发布代码须遵守我们的网站规则。
免责声明
这些信息和出版物并非旨在提供,也不构成TradingView提供或认可的任何形式的财务、投资、交易或其他类型的建议或推荐。请阅读使用条款了解更多信息。
免责声明
这些信息和出版物并非旨在提供,也不构成TradingView提供或认可的任何形式的财务、投资、交易或其他类型的建议或推荐。请阅读使用条款了解更多信息。