OPEN-SOURCE SCRIPT
RahulLines Cloud
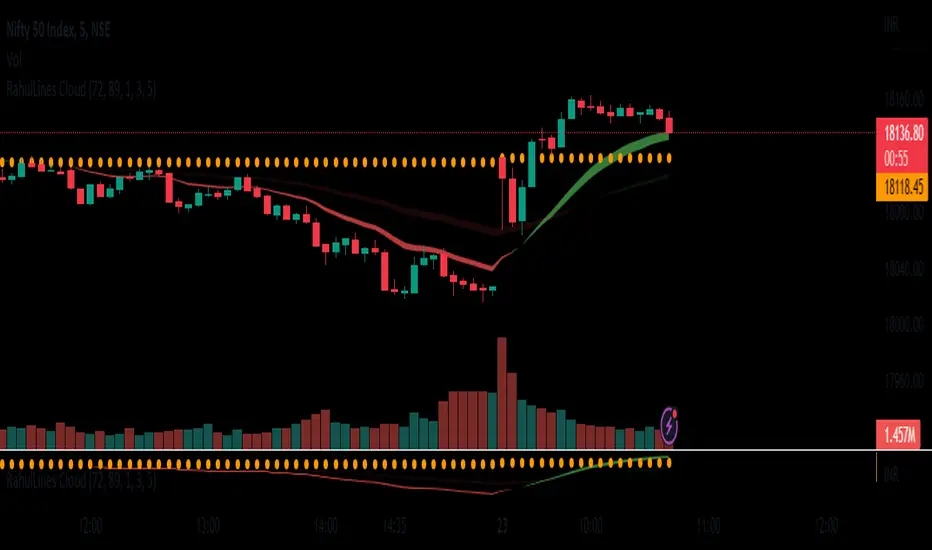
J-Lines Cloud is a technical analysis tool that is used to identify potential support and resistance levels on a chart. It is based on the concept of the "J-Lines," which are lines that are drawn on a chart in order to identify potential turning points in price. The J-Lines Cloud is a variation of the J-Lines that is used to identify levels of support and resistance using cloud, it typically uses multiple lines to create a cloud-like shape, which represents a zone of support or resistance.
To use the J-Lines Cloud, you will typically need a charting platform that has the ability to plot the J-Lines Cloud indicator. The indicator will typically take the form of a cloud-like shape on the chart, with different colors used to represent different levels of support and resistance.
Once the J-Lines Cloud is plotted on the chart, traders can use it to identify potential levels at which the price of an asset may change direction. For example, if the price of an asset is approaching a level of resistance identified by the J-Lines Cloud, a trader may choose to sell or exit a long position. Conversely, if the price of an asset is approaching a level of support identified by the J-Lines Cloud, a trader may choose to buy or enter a long position.
It's important to note that the J-Lines Cloud is a tool for technical analysis and not a standalone strategy, it should be used in combination with other indicators or strategies and also it should be used with the proper risk management and stop loss analysis.
开源脚本
秉承TradingView的精神,该脚本的作者将其开源,以便交易者可以查看和验证其功能。向作者致敬!您可以免费使用该脚本,但请记住,重新发布代码须遵守我们的网站规则。
免责声明
这些信息和出版物并非旨在提供,也不构成TradingView提供或认可的任何形式的财务、投资、交易或其他类型的建议或推荐。请阅读使用条款了解更多信息。
开源脚本
秉承TradingView的精神,该脚本的作者将其开源,以便交易者可以查看和验证其功能。向作者致敬!您可以免费使用该脚本,但请记住,重新发布代码须遵守我们的网站规则。
免责声明
这些信息和出版物并非旨在提供,也不构成TradingView提供或认可的任何形式的财务、投资、交易或其他类型的建议或推荐。请阅读使用条款了解更多信息。