OPEN-SOURCE SCRIPT
已更新 Supply and Demand Zones
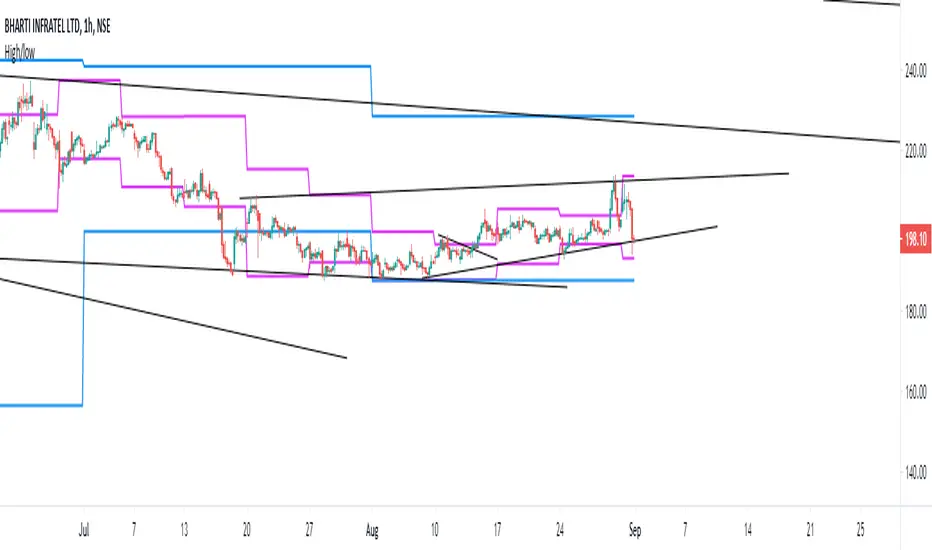
This indicators should be used along with price action breakout
Red zones - Red zones are formed daily
10 days average ranges
Blue zones - Blue zones are formed every week
10 weeks average ranges
Green zones - Green zones are formed every month
10 months averange ranges
Red zones - Red zones are formed daily
10 days average ranges
Blue zones - Blue zones are formed every week
10 weeks average ranges
Green zones - Green zones are formed every month
10 months averange ranges
版本注释
It will just plot the close price版本注释
It will plot the previous day's high and low版本注释
Now it will plot previous day , previous week and previous month high and low开源脚本
秉承TradingView的精神,该脚本的作者将其开源,以便交易者可以查看和验证其功能。向作者致敬!您可以免费使用该脚本,但请记住,重新发布代码须遵守我们的网站规则。
免责声明
这些信息和出版物并非旨在提供,也不构成TradingView提供或认可的任何形式的财务、投资、交易或其他类型的建议或推荐。请阅读使用条款了解更多信息。
开源脚本
秉承TradingView的精神,该脚本的作者将其开源,以便交易者可以查看和验证其功能。向作者致敬!您可以免费使用该脚本,但请记住,重新发布代码须遵守我们的网站规则。
免责声明
这些信息和出版物并非旨在提供,也不构成TradingView提供或认可的任何形式的财务、投资、交易或其他类型的建议或推荐。请阅读使用条款了解更多信息。