PROTECTED SOURCE SCRIPT
已更新 Jack Corsellis RS Line
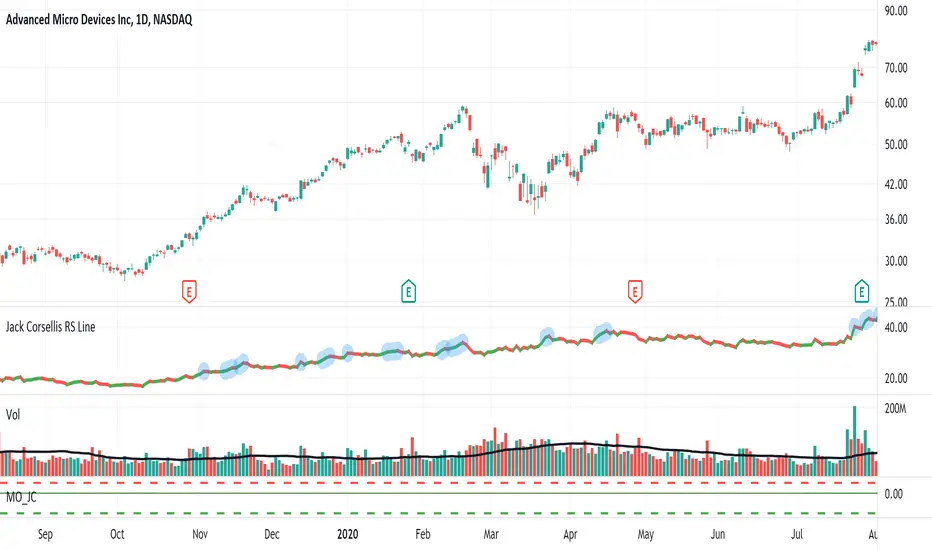
Relative Strength line which shows a blue dot for new 52 week Relative Strength highs.
版本注释
Jack Corsellis RS Line Rev 1版本注释
New update.Consistent 52 week blue dot high on daily, weekly and monthly.
No blue dots intraday.
版本注释
Revisions:1. Added the ability to plot a simple moving average (SMA) of the relative strength line.
This default is OFF (not displayed) and can be toggled ON (displayed) within the options.
The default SMA length is set to 50 days and can be configured within the options.
版本注释
Updated chart screenshot版本注释
Updated screenshot版本注释
Added Red Dot Low on Daily, Weekly and Monthly timeframes. No red dots will be displayed on intraday timeframes.Default look back period for lows is set to 52 weeks.
Indicator settings allow for this period to be configured, visibility of dot to be toggled and appearance to be changed.
受保护脚本
此脚本以闭源形式发布。 但是,您可以自由使用,没有任何限制 — 了解更多信息这里。
免责声明
这些信息和出版物并非旨在提供,也不构成TradingView提供或认可的任何形式的财务、投资、交易或其他类型的建议或推荐。请阅读使用条款了解更多信息。
受保护脚本
此脚本以闭源形式发布。 但是,您可以自由使用,没有任何限制 — 了解更多信息这里。
免责声明
这些信息和出版物并非旨在提供,也不构成TradingView提供或认可的任何形式的财务、投资、交易或其他类型的建议或推荐。请阅读使用条款了解更多信息。