OPEN-SOURCE SCRIPT
Is it Time for a Pullback? Check Bars Since MA Test
An old market adage declares that “prices never move in a straight line.” Dips occur even in bullish markets. But how can traders know when prices may be due for a pullback?
Today’s script tries to answer that question by asking how many bars have passed since a stock, index or other symbol has tested a given moving average. Long periods of time without touching a line such as the 50-day simple moving average, for example, could prompt traders to be more patient.
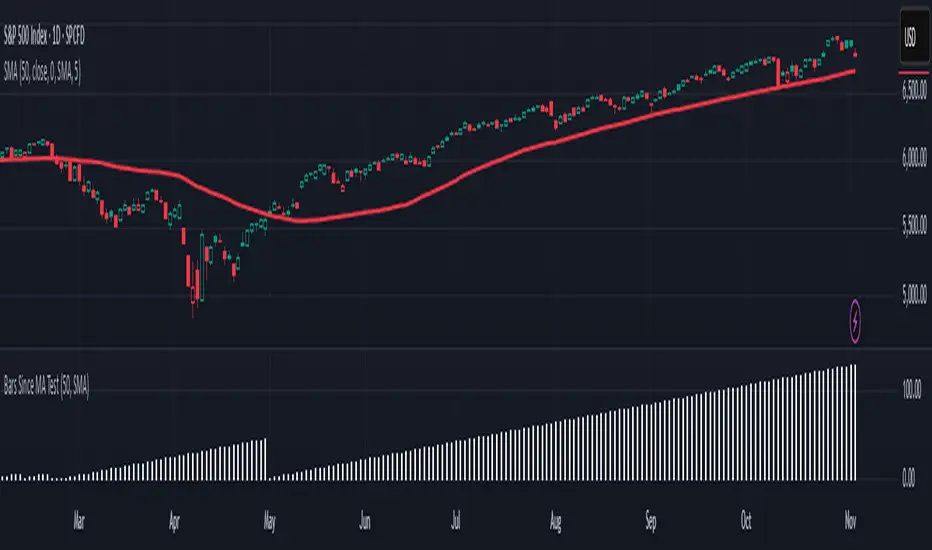
Bars Since MA Test counts how many bars have passed since prices touched or crossed the MA in question. The resulting value is plotted in a simple histogram. Users can set the MA length and type. By default, it uses the 50-day simple moving average (SMA).
The chart above applies Bars Since MA Test to the S&P 500. It shows that the index has gone 129 bars without testing its 50-day SMA. That’s the longest since a 146-bar stretch between July 2006 and February 2007.
Other longer runs include January-August 1995 (156 bars), November 1960-June 1961 (144 bars) and April-November 1958 (158 bars).
Given the small number of comparable readings, could traders suspect the current advance is getting long in the tooth?
TradeStation has, for decades, advanced the trading industry, providing access to stocks, options and futures. If you're born to trade, we could be for you. See our Overview for more.
Past performance, whether actual or indicated by historical tests of strategies, is no guarantee of future performance or success. There is a possibility that you may sustain a loss equal to or greater than your entire investment regardless of which asset class you trade (equities, options or futures); therefore, you should not invest or risk money that you cannot afford to lose. Online trading is not suitable for all investors. View the document titled Characteristics and Risks of Standardized Options at https://www.TradeStation.com/DisclosureOptions. Before trading any asset class, customers must read the relevant risk disclosure statements on https://www.TradeStation.com/Important-Information/. System access and trade placement and execution may be delayed or fail due to market volatility and volume, quote delays, system and software errors, Internet traffic, outages and other factors.
Securities and futures trading is offered to self-directed customers by TradeStation Securities, Inc., a broker-dealer registered with the Securities and Exchange Commission and a futures commission merchant licensed with the Commodity Futures Trading Commission). TradeStation Securities is a member of the Financial Industry Regulatory Authority, the National Futures Association, and a number of exchanges.
TradeStation Securities, Inc. and TradeStation Technologies, Inc. are each wholly owned subsidiaries of TradeStation Group, Inc., both operating, and providing products and services, under the TradeStation brand and trademark. When applying for, or purchasing, accounts, subscriptions, products and services, it is important that you know which company you will be dealing with. Visit https://www.TradeStation.com/DisclosureTSCompanies for further important information explaining what this means.
Today’s script tries to answer that question by asking how many bars have passed since a stock, index or other symbol has tested a given moving average. Long periods of time without touching a line such as the 50-day simple moving average, for example, could prompt traders to be more patient.
Bars Since MA Test counts how many bars have passed since prices touched or crossed the MA in question. The resulting value is plotted in a simple histogram. Users can set the MA length and type. By default, it uses the 50-day simple moving average (SMA).
The chart above applies Bars Since MA Test to the S&P 500. It shows that the index has gone 129 bars without testing its 50-day SMA. That’s the longest since a 146-bar stretch between July 2006 and February 2007.
Other longer runs include January-August 1995 (156 bars), November 1960-June 1961 (144 bars) and April-November 1958 (158 bars).
Given the small number of comparable readings, could traders suspect the current advance is getting long in the tooth?
TradeStation has, for decades, advanced the trading industry, providing access to stocks, options and futures. If you're born to trade, we could be for you. See our Overview for more.
Past performance, whether actual or indicated by historical tests of strategies, is no guarantee of future performance or success. There is a possibility that you may sustain a loss equal to or greater than your entire investment regardless of which asset class you trade (equities, options or futures); therefore, you should not invest or risk money that you cannot afford to lose. Online trading is not suitable for all investors. View the document titled Characteristics and Risks of Standardized Options at https://www.TradeStation.com/DisclosureOptions. Before trading any asset class, customers must read the relevant risk disclosure statements on https://www.TradeStation.com/Important-Information/. System access and trade placement and execution may be delayed or fail due to market volatility and volume, quote delays, system and software errors, Internet traffic, outages and other factors.
Securities and futures trading is offered to self-directed customers by TradeStation Securities, Inc., a broker-dealer registered with the Securities and Exchange Commission and a futures commission merchant licensed with the Commodity Futures Trading Commission). TradeStation Securities is a member of the Financial Industry Regulatory Authority, the National Futures Association, and a number of exchanges.
TradeStation Securities, Inc. and TradeStation Technologies, Inc. are each wholly owned subsidiaries of TradeStation Group, Inc., both operating, and providing products and services, under the TradeStation brand and trademark. When applying for, or purchasing, accounts, subscriptions, products and services, it is important that you know which company you will be dealing with. Visit https://www.TradeStation.com/DisclosureTSCompanies for further important information explaining what this means.
开源脚本
秉承TradingView的精神,该脚本的作者将其开源,以便交易者可以查看和验证其功能。向作者致敬!您可以免费使用该脚本,但请记住,重新发布代码须遵守我们的网站规则。
免责声明
这些信息和出版物并非旨在提供,也不构成TradingView提供或认可的任何形式的财务、投资、交易或其他类型的建议或推荐。请阅读使用条款了解更多信息。
开源脚本
秉承TradingView的精神,该脚本的作者将其开源,以便交易者可以查看和验证其功能。向作者致敬!您可以免费使用该脚本,但请记住,重新发布代码须遵守我们的网站规则。
免责声明
这些信息和出版物并非旨在提供,也不构成TradingView提供或认可的任何形式的财务、投资、交易或其他类型的建议或推荐。请阅读使用条款了解更多信息。