OPEN-SOURCE SCRIPT
Price Deviation Table by ZonkeyXL

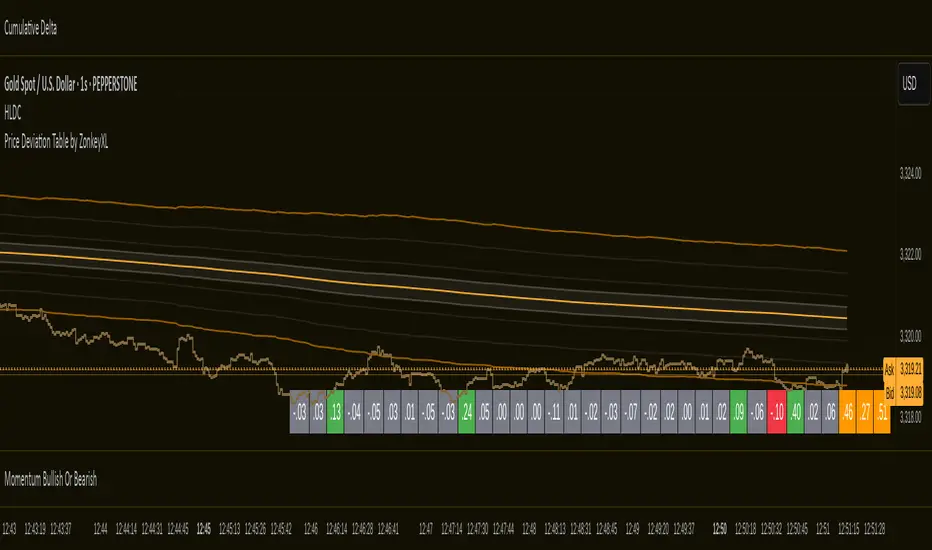
Provides a 30 column table showing price deviation per bar close, highlighting larger deviations in red (downside) or green (upside).
Deviations that get highlighted in red/green are calculated to be 2x the amount of price movement in the previous candle, but can be customised to check any deviation size you want in the options panel.
Can be used on any timeframe but you need to specify the number of bars per table column to make it accurate to what you want.
Examples:
If used on the 1 second time frame you could specify bars to 1 and then each column value will check the price as at close on the most recent second for deviations against the close of price on the second prior, showing comparisons up to 30 seconds.
If on the 1 minute time-frame you could specify bars to 2 and then each column value would show deviations from most recent price close to 2 minutes ago, making all 30 columns show deviations for up to an hour.
At the end of the column are 3 orange coloured columns. The first one compares price to 10 bars ago. The second compares current price to 20 bars ago. The 3rd compares current price to 30 bars ago.
In our example on the 1 second above, this would mean deviation is calculated by comparing most recent close to 10 seconds ago, then to 20 seconds ago, and then to 30 seconds ago. The final 3 columns do not highlight red or green, so you can differentiate them properly from the main deviation columns at all times.
Note that the table is rolling - so once it is populated for the first time, only the final column will update while the prior values will shift one column to the left.
开源脚本
秉承TradingView的精神,该脚本的作者将其开源,以便交易者可以查看和验证其功能。向作者致敬!您可以免费使用该脚本,但请记住,重新发布代码须遵守我们的网站规则。
免责声明
这些信息和出版物并非旨在提供,也不构成TradingView提供或认可的任何形式的财务、投资、交易或其他类型的建议或推荐。请阅读使用条款了解更多信息。
开源脚本
秉承TradingView的精神,该脚本的作者将其开源,以便交易者可以查看和验证其功能。向作者致敬!您可以免费使用该脚本,但请记住,重新发布代码须遵守我们的网站规则。
免责声明
这些信息和出版物并非旨在提供,也不构成TradingView提供或认可的任何形式的财务、投资、交易或其他类型的建议或推荐。请阅读使用条款了解更多信息。