OPEN-SOURCE SCRIPT
已更新 Moving Average Percentage Difference
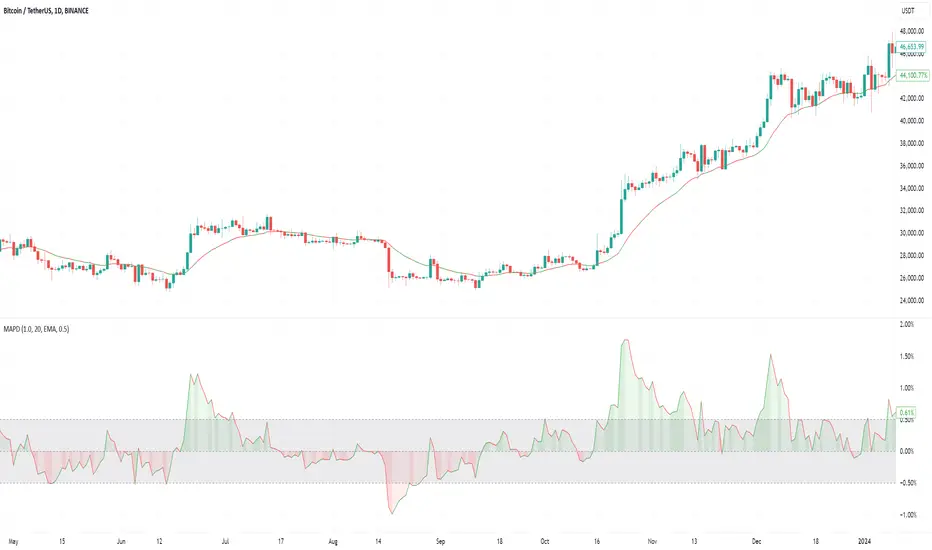
Moving average is a great tool to identify the asset direction. However, it's hard to see whether the moving average speeds up or slows down from just looking at it. Ideally we want it to go faster as it will show a strong trend. And if it slows down - then the trend becomes weaker. This indicator helps to identify it. Theoretically, it could be shown with an angle of the moving average, but I don't like this idea as the angle depends on the scale: you zoom in and it looks very steep, you zoom out - and it's all flat. But the percentage change is always the percentage, no matter what zoom you use.
It also allows you to set a twilight zone to filter periods when MA does nothing.
Think about this indicator from this perspective: if a normal moving average shows the speed of a trend, then this indicator shows the change of the speed or in other words - acceleration.
It also allows you to set a twilight zone to filter periods when MA does nothing.
Think about this indicator from this perspective: if a normal moving average shows the speed of a trend, then this indicator shows the change of the speed or in other words - acceleration.
版本注释
V1.1:- Updated PineScript to V6
- Updated the description (see below)
What does this indicator do (for regular users)?
It calculates the percentage change of a moving average compared to its value one candle ago. You can choose from seven types of moving averages.
What does this indicator do (for technical users)?
It computes the rate of change (ROC) with a period of 2 for SMA, EMA, VWMA, RMA, WMA, HMA, or SWMA.
Why is this important?
Traders often use the point when a moving average changes direction as a signal for entry or exit. This indicator helps anticipate such changes. Before a moving average changes direction, it must first slow down. The indicator reveals whether the moving average is slowing down or speeding up.
Think of it like this: before a car moves backward, it must slow down, stop, and then reverse. Moving averages behave similarly. Instead of guessing whether your moving average is slowing down or speeding up just by observing it, you can use this indicator to get a precise numeric value.
Additional feature:
You can define a "twilight zone" to highlight areas where the moving average experiences whipsawing. This is useful for trend followers to avoid flat periods or for mean-reversion strategies to identify favorable conditions.
开源脚本
秉承TradingView的精神,该脚本的作者将其开源,以便交易者可以查看和验证其功能。向作者致敬!您可以免费使用该脚本,但请记住,重新发布代码须遵守我们的网站规则。
免责声明
这些信息和出版物并非旨在提供,也不构成TradingView提供或认可的任何形式的财务、投资、交易或其他类型的建议或推荐。请阅读使用条款了解更多信息。
免责声明
这些信息和出版物并非旨在提供,也不构成TradingView提供或认可的任何形式的财务、投资、交易或其他类型的建议或推荐。请阅读使用条款了解更多信息。