OPEN-SOURCE SCRIPT
Extreme Candle Pattern Visualizer

🟠 OVERVIEW
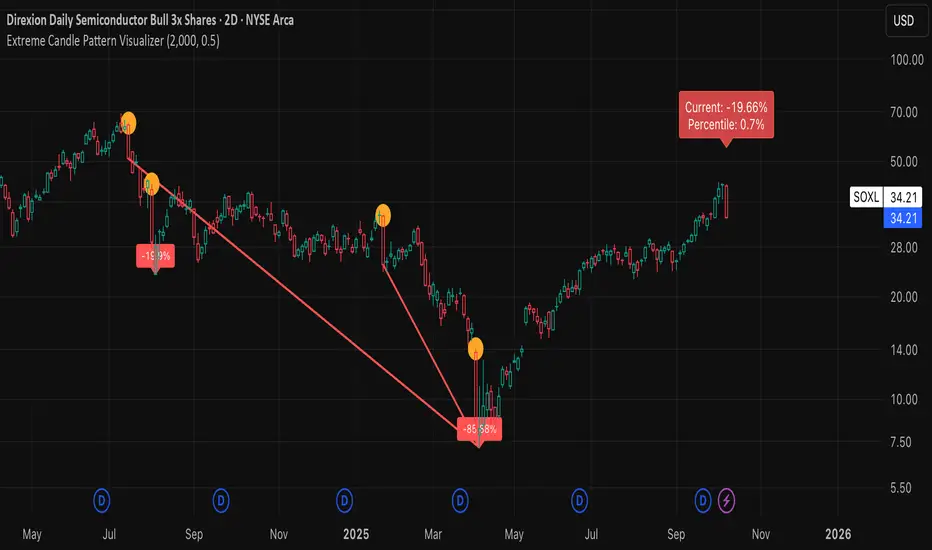
This indicator compares the current candle's percentage change against historical data, then highlights past candles with equal or bigger magnitude of movement. Also, for all the highlighted past candles, it tracks how far price extends before recovering to its starting point. It also provides statistical context through percentile rankings.
IN SHORT: Quickly spot similar price movements in the past and understand how unusual the current candle is using percentile rankings.
🟠 CORE CONCEPT
The indicator operates on two fundamental principles:
1. Statistical Rarity Detection
The script calculates the percentage change (open to close) of every candle within a user-defined lookback period and determines where the current candle ranks in this distribution. A candle closing at -9% might fall in the bottom 5th percentile, indicating it's more extreme than 95% of recent candles. This percentile ranking helps traders identify statistically unusual moves that often precede reversals or extended trends.
2. Recovery Path Mapping
Once extreme candles are identified (those matching or exceeding the current candle's magnitude), the indicator tracks their subsequent price action. For bearish candles, it measures how far price dropped before recovering back to the candle's opening price. For bullish candles, it tracks how high price climbed before returning to the open. This reveals whether extreme moves typically extend further or reverse quickly.
🟠 PRACTICAL APPLICATIONS
Mean Reversion Trading:
Candles in extreme percentiles (below 10% or above 90%) often signal oversold/overbought conditions. The recovery lines show typical extension distances, helping traders set profit targets for counter-trend entries.
Momentum Continuation:
When extreme candles show small recovery percentages before price reverses back, it suggests strong directional momentum that may continue.
Stop Loss Placement:
Historical recovery data reveals typical extension ranges after extreme moves, informing more precise stop loss positioning beyond noise but before major reversals.
Pattern Recognition:
By visualizing how similar historical extremes resolved, traders gain context for current price action rather than trading in isolation.
🟠 VISUAL ELEMENTS
Orange Circles: Mark historical candles with similar or greater magnitude to current candle
Red Lines: Track downward extensions after bearish extreme candles
Green Lines: Track upward extensions after bullish extreme candles
Percentage Labels: Show exact extension distance from candle close to extreme point
Percentile Label: Color-coded box displaying current candle's statistical ranking
Hollow Candles: Background rendering for clean chart presentation
🟠 ORIGINALITY
This indicator uniquely combines statistical percentile analysis with forward-looking recovery tracking. While many indicators identify extreme moves, few show what happened next across multiple historical instances simultaneously. The dual approach provides both the "how rare is this?" question (percentile) and "what typically happens after?" answer (recovery paths) in a single visual framework.
开源脚本
秉承TradingView的精神,该脚本的作者将其开源,以便交易者可以查看和验证其功能。向作者致敬!您可以免费使用该脚本,但请记住,重新发布代码须遵守我们的网站规则。
免责声明
这些信息和出版物并非旨在提供,也不构成TradingView提供或认可的任何形式的财务、投资、交易或其他类型的建议或推荐。请阅读使用条款了解更多信息。
开源脚本
秉承TradingView的精神,该脚本的作者将其开源,以便交易者可以查看和验证其功能。向作者致敬!您可以免费使用该脚本,但请记住,重新发布代码须遵守我们的网站规则。
免责声明
这些信息和出版物并非旨在提供,也不构成TradingView提供或认可的任何形式的财务、投资、交易或其他类型的建议或推荐。请阅读使用条款了解更多信息。