OPEN-SOURCE SCRIPT
Gedhusek TrendFibonacci
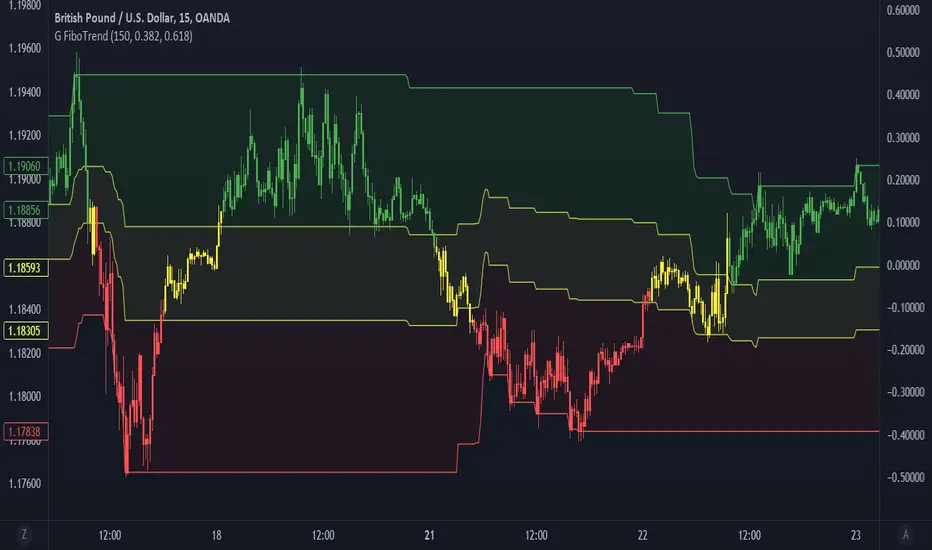
This indicator is a trend filter based on fibonacci retracement levels
How to read:
- There are three filled zones --> red, yellow and green
- If the price is inside of red zone, there is a downtrend on the market
- If the price is inside the yellow zone, there is a sideways trend on the market
- If the price is inside the green zone, there is a uptrend on the market
- Also, candles are going to have a corresponding color based on the current trend
Calculations of the indicator:
1. Calculate distance between maximal and minimal price over the last "x" bars (choose value for "x" in inputs menu under the "Analysis period")
2. Use this distance for calculating two retracement levels (choose retracement levels in inputs menu)
3. These two retracement levels create an area of what is going to be considered as sideways market
Example:
- Lets say we chose Analysis period of 100, Lower Fibonacci Level as 0.382 and Upper Fibonacci Level as 0.618
- Maximum price over the last 100 bars was of 120 and minimum price was 20. That leaves us with the difference of 100 points
- Now we calculate the fibonacci levels --> 100*0.382 = 38.2 and 100*0.618 = 61.8
- The next step is to add the levels to the lowest price point --> 20 + 38.2 = 58.2 and 20 + 61.8 = 81.8
- And now we have our zones. If the price is going to be below the lower fibonacci level (in this case 58.2), we consider it as a bearish trend. If the price is between those fibonacci levels (58.2 and 81.8), we consider it as a sideways trend. And if the price is above the upper fibonacci level (81.8), we consider it as a bullish trend.
Inputs:
- Analysis period --> number of bars within which the system is going to look for max and min price
- Lower Fibonacci Level --> Choose from options and must be lower or the same as "Upper Fibonacci Level"
- Upper Fibonacci Level --> Choose from options and must be higher or the same as "Lower Fibonacci Level"
- Show Filling --> whether you wish to fill the areas with color
- Change Candle Color --> whether you wish to change the color of candles based on current trend.
开源脚本
秉承TradingView的精神,该脚本的作者将其开源,以便交易者可以查看和验证其功能。向作者致敬!您可以免费使用该脚本,但请记住,重新发布代码须遵守我们的网站规则。
免责声明
这些信息和出版物并非旨在提供,也不构成TradingView提供或认可的任何形式的财务、投资、交易或其他类型的建议或推荐。请阅读使用条款了解更多信息。
免责声明
这些信息和出版物并非旨在提供,也不构成TradingView提供或认可的任何形式的财务、投资、交易或其他类型的建议或推荐。请阅读使用条款了解更多信息。