OPEN-SOURCE SCRIPT
已更新 Market Sessions
Market Sessions Indicator Overview:
The "Market Sessions" indicator is a powerful tool designed to enhance traders' insights by providing comprehensive information about key market sessions, daily high/low values, and important exponential moving averages (EMAs) directly on the trading chart.

Key Features:
Market Sessions Display:
Daily High/Low:
Exponential Moving Averages (EMAs):
Dashboard Information:
Stock Session Information:
Usage Guidelines:
Market Session Identification: Easily identify distinct market sessions using color-coded shapes and background color changes.
Daily Analysis: Quickly reference labeled lines for the high and low values of the previous trading day.
Trend Analysis: Observe the plotted EMAs on the chart for insights into the prevailing trends.
Real-time Monitoring: Utilize the dashboard for real-time information on current and upcoming sessions.
Stock Session Details: Identify specific open and close times for stock sessions, aiding in strategic planning.

Customization Options:
User-Friendly Parameters: Customize visibility, color, and positioning based on individual preferences.
Dashboard Configuration: Adjust dashboard position, text placement, and EMA parameters to tailor the indicator to specific needs.
Backtesting Feature:
The indicator includes a backtest feature, allowing users to visualize past sessions for testing and refining trading strategies.
This Market Sessions Indicator provides traders with a holistic view of market dynamics, facilitating informed decision-making and enhancing overall trading experiences.
The "Market Sessions" indicator is a powerful tool designed to enhance traders' insights by providing comprehensive information about key market sessions, daily high/low values, and important exponential moving averages (EMAs) directly on the trading chart.
Key Features:
Market Sessions Display:
- Visually represents Sydney/Tokyo, London, and New York sessions using distinct color-coded shapes.
- Enhances visibility by dynamically changing the background color during specific trading sessions.
Daily High/Low:
- Plots and labels the high and low values of the previous trading day on the chart.
- Customizable colors for daily high and low markers.
Exponential Moving Averages (EMAs):
- Includes 20, 50, and 200-period EMAs for comprehensive trend analysis.
- Users have the flexibility to customize the visibility and color of each EMA.
Dashboard Information:
- Real-time information about the current and upcoming market sessions.
- Displays the time remaining for the upcoming session, aiding in timely decision-making.
Stock Session Information:
- Clearly marks open and close times for Asia, Euro, and USA stock sessions.
- Customizable visibility options for stock open/close lines, allowing for a tailored chart display.
Usage Guidelines:
Market Session Identification: Easily identify distinct market sessions using color-coded shapes and background color changes.
Daily Analysis: Quickly reference labeled lines for the high and low values of the previous trading day.
Trend Analysis: Observe the plotted EMAs on the chart for insights into the prevailing trends.
Real-time Monitoring: Utilize the dashboard for real-time information on current and upcoming sessions.
Stock Session Details: Identify specific open and close times for stock sessions, aiding in strategic planning.
Customization Options:
User-Friendly Parameters: Customize visibility, color, and positioning based on individual preferences.
Dashboard Configuration: Adjust dashboard position, text placement, and EMA parameters to tailor the indicator to specific needs.
Backtesting Feature:
The indicator includes a backtest feature, allowing users to visualize past sessions for testing and refining trading strategies.
This Market Sessions Indicator provides traders with a holistic view of market dynamics, facilitating informed decision-making and enhancing overall trading experiences.
版本注释
Correctet Wrong Dashboard Values from USA Session close to USA - Asia gap版本注释
Fixed Timer for USA Session版本注释
Info UpdateDefault Time Zone:
The indicator uses the default time zone setting on TradingView for session calculations and time-related functions.
Daily High/Low
Shows Price in The Status Line
Usage:
Customizing Settings:
Use the indicator settings to toggle display options for different features.
Adjust colors, text positions, and dashboard placement according to your preferences.
Analyzing Market Sessions:
Observe the colored squares at the bottom to identify the current market session.
Use daily high/low levels and stock open/close information for technical analysis.
Leverage the EMA overlay to spot potential trend reversals.
Understanding Dashboard:
Refer to the dashboard for real-time information about the current and next trading sessions.
Stay informed about market dynamics and improve your trading decisions with the Market Sessions Indicator. Explore the various features and tailor them to your trading strategy for a comprehensive analysis of market behavior during different sessions.
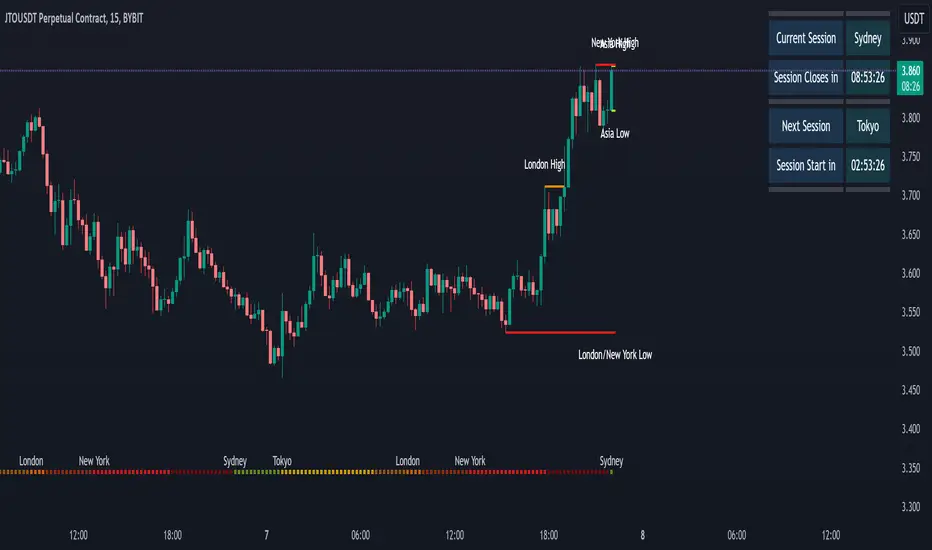
Market Session Squares Overview:
The colored squares at the bottom of the chart represent different trading sessions—Asia, Europe (London), and USA (New York). The color intensity in these squares is designed to reflect the relative liquidity during each session. Here's a breakdown of how the colors can be interpreted:
Asia Session (Sydney/Tokyo):
Color: Light Green
Interpretation: The lighter green color indicates the start of the trading day in the Asian markets (Sydney/Tokyo). Liquidity during this session is relatively lower compared to other sessions.
Europe Session (London):
Color: Gradual Transition from Light Green to Red
Interpretation: The color transition from light green to red signifies the increasing liquidity as the European session (London) unfolds. London is a major financial hub, contributing to higher trading volumes.
USA Session (New York):
Color: Deep Red
Interpretation: The deep red color represents the peak of liquidity during the USA session (New York). This session overlaps with the London session, creating a period of maximum trading activity and market participation.
Interpreting Color Intensity:
Light Green: Low liquidity, the beginning of a session.
Red Transition: Increasing liquidity, reaching a peak.
Deep Red: Maximum liquidity, session overlap (London and New York).
Note:
The Market Session Indicator Works only on 1H Timeframe and Lower, The Dashboard and Daily High/Low on All
The color scheme aims to provide a visual guide to traders, helping them identify periods of higher or lower market activity. The intensity of the red color indicates the significance of the session in terms of liquidity, with the deepest red occurring during the overlap of the London and New York sessions.
版本注释
Updates:- Changed Name of Low Volume Zone to US/Asia Gap (US/Asia Gap Stands for Daily Bank Algo
- reset
- Correctet Dashboard for US/Asia Gap
版本注释
-版本注释
- Stock Open/Close Shows Only if On, Previous Version was always on for The Backtest
- Changed Titel for Stock Open/Close Input
版本注释
Updateds- Updtated script for better understanding
- Corrected NewYork text for backtest
版本注释
Added Daily Open and Daily Close版本注释
Added Stock Open and Closing time to the Dashboard
版本注释
Key Features1. Market Session Times
- Automatically adjusts session timings for Sydney, Tokyo, London, and New York.
- New: Users can now switch between Forex and Stock session schedules via a simple dropdown.
- Supports automatic Daylight Saving Time adjustments.
2. Session Highs and Lows
- Tracks session-specific highs and lows with bar counts since these levels were formed.
- Identifies breaches and retests of session levels, critical for intraday trading.
3. Daily Highs, Lows, Open, and Close
- Plots the previous day's high, low, open, and close levels for intraday reference.
- Levels are visible only on timeframes 4H and below, emphasizing intraday trading relevance.
4. Dashboard and Visualization
- Real-time dashboard with current and upcoming session details, including countdowns for the next session.
- Session overlaps and low-volume zones, like the US/Asia Gap, are highlighted dynamically.
5. Customization Options
- Fully customizable colors, labels, and session visualizations to suit individual preferences.
- Dynamic label positioning ensures a clean and clutter-free chart view.
Usage and Customization
Session Analysis
- Analyze active and historical session highs/lows to plan trades around key liquidity zones.
- Leverage session overlaps for timing market entries and exits.
Daily Levels
- Use the daily high, low, open, and close levels to identify key intraday support and resistance.
- Available only on 4H and lower timeframes, providing actionable levels for short-term strategies.
Dashboard Features
- Monitor real-time session status with countdowns and overlaps.
- Visualize low-volume zones and session gaps for better timing and market analysis.
What’s New in This Version
Removed EMAs:
- Exponential Moving Averages (EMAs) are no longer part of this indicator, focusing solely on session analysis and daily levels.
Forex and Stock Session Selection:
- A new dropdown allows users to seamlessly toggle between Forex and Stock session schedules, catering to both markets.
Daily Levels Restriction:
- Daily high, low, open, and close levels are only displayed on timeframes 4H and below for intraday precision.
Enhanced Session Logic:
- Updated session high/low tracking with bar counts and visual indicators.
- Improved session overlap visualizations and gap highlighting.
Redesigned Dashboard:
- Cleaner, real-time display for session countdowns and overlaps.
版本注释
Changed from Version 5 to Versoin 6Updated DST Summer and Winter Time
开源脚本
秉承TradingView的精神,该脚本的作者将其开源,以便交易者可以查看和验证其功能。向作者致敬!您可以免费使用该脚本,但请记住,重新发布代码须遵守我们的网站规则。
免责声明
这些信息和出版物并非旨在提供,也不构成TradingView提供或认可的任何形式的财务、投资、交易或其他类型的建议或推荐。请阅读使用条款了解更多信息。
免责声明
这些信息和出版物并非旨在提供,也不构成TradingView提供或认可的任何形式的财务、投资、交易或其他类型的建议或推荐。请阅读使用条款了解更多信息。