INVITE-ONLY SCRIPT
已更新 S&P 500 Scanner
🚀 S&P 500 Scanner – TradingView Stock Screener for Reversals
Catch early bullish & bearish signals in S&P 500 stocks. Real-time TradingView scanner for scalping, day trading & swing trading with non-lagging alerts.
________________________________________
👋 Meet Your New Trading Buddy
Looking for an intelligent S&P 500 scanner on TradingView?
Say hello to your new edge—the S&P 500 Stock Scanner, a professional tool for spotting bullish and bearish reversals in America’s biggest, most liquid companies.
No more doomscrolling 500 charts manually (seriously, who has time for that? 😅). Instead, get real-time buy/sell signals, alerts, and chart markers for scalping, day trading, and swing trading—all without lagging indicators.
________________________________________
🔥 Why This S&P 500 Screener Rocks
- Catch SP500 reversals early before the herd piles in.
- Trade 500 blue-chip US stocks—Apple, Nvidia, Tesla, Microsoft, you name it.
- Get “non-lagging” stock signals based on candlestick patterns, divergences, and momentum.
- Works in real-time during U.S. market hours.
Perfect for anyone searching:
👉 “SP500 stock screener”
👉 “TradingView S&P 500 scanner”
👉 “candlestick reversal indicator”
👉 “day trading scanner US stocks”
Basically, if it’s in the top 500 US companies, this scanner will find the next move before your cousin’s “hot stock tip” shows up on WhatsApp. 📲😂
________________________________________
📊 What is the S&P 500 Anyway?
The S&P 500 Index is the gold standard of U.S. equities. It tracks 500 of the strongest companies, representing over $50 trillion in market cap (yes, trillion with a T 💰).
From tech beasts like Apple 🍏 and Nvidia 💻 to financial powerhouses like JPMorgan 🏦 and Berkshire Hathaway 🐂, these are the stocks that move global markets.
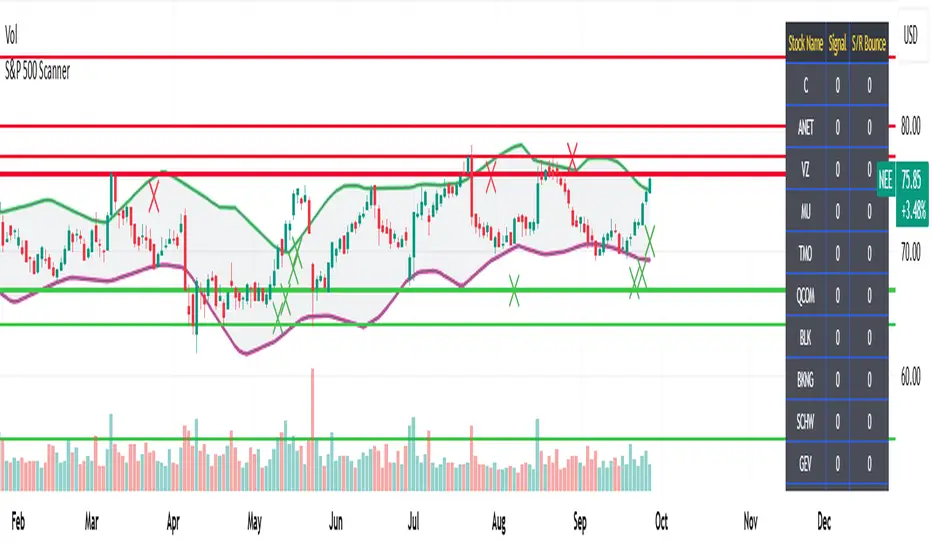
Our S&P 500 Scanner analyzes them all—broken into 20 groups with 25 stocks each—giving you “bullish/bearish signals S&P500” on every timeframe:
⏱ Scalpers → 1m–5m charts
📉 Day traders → 15m–1h charts
📈 Swing traders → Daily/Weekly setups
________________________________________
⚙️ How the Scanner Works
✅ Hard-Coded Groups → 20 groups × 25 stocks = full SP500 coverage.
✅ Table View → See live signals:
🟢 Green 1 = bullish reversal
🔴 Red 2 = bearish reversal
✅ X Markers on Charts → Green below for buys, red above for sells.
✅ Auto Support/Resistance → Confidence boosters for entries.
✅ 50+ Pattern Detection → Hammers, dojis, engulfing, divergences, exhaustion.
What are the Rules of using it? Very Simple:
- Long = enter above Green X ✅
- Short = enter below Red X ❌
- Stop loss = previous candle's close 🛑
- Target = 2–7% or until opposite signal appears 🎯
________________________________________
🚨 Group-Level Alerts = Less Screen Time
Set one alert per group and relax. When you set up alert on even 1 stock of any Group, you will get notified of reversal Signal developing in any other stock too which is part of this group, you’ll know instantly— so it is ideal for day trading alerts on S&P500 stocks as well as for swing trading.
________________________________________
🎯 Why Traders Love It
- Time Saver ⏳: No need to scan 500 charts.
- Early Bird Advantage 🐦: Enter before lagging indicators catch up.
- High Liquidity 💧: Trade top U.S. stocks with seamless execution.
- Flexible Strategies 🔀: Scalping, intraday, or swing.
- Custom Alerts 🔔: Never miss bullish/bearish setups again.
If you’ve ever searched “early entry stock scanner TradingView” or “best SP500 reversal screener”, this is built for you.
________________________________________
📈 Trading Strategies Made Easy
- Scalping Tool: Fast moves on 1–5m charts.
- Day Trading Indicator: Intraday reversals during U.S. hours.
- Swing Trading Scanner: Daily setups with trend continuation.
- Adapt to your style and trade smarter, not harder.
________________________________________
🔍 Optimized For Traders Searching:
- “S&P 500 stock screener TradingView”
- “real-time reversal alerts SP500”
- “candlestick pattern scanner US stocks”
- “best day trading indicator SP500”
- “non-lagging SP500 trading strategy”
________________________________________
🚀 Ready to Scan Like a Pro?
✅ Load the S&P 500 Scanner on your TradingView charts today.
✅ Catch reversals early, trade with confidence, and get a head starts vis-a-vis lagging indicators 🥊.
________________________________________
⚠️ Disclaimer
✅ This indicator provides technical trading signals based on price action, candlestick patterns, and momentum.
✅ It does not replace your financial advisor. 📉📈
✅ Use it as a technical edge, while doing your own fundamental research or following guidance from your advisor for long-term decisions.
版本注释
Update: Updated the logic to filter out weak signals.仅限邀请脚本
只有经作者批准的用户才能访问此脚本。您需要申请并获得使用权限。该权限通常在付款后授予。如需了解更多详情,请按照以下作者的说明操作,或直接联系jellygill。
除非您完全信任其作者并了解脚本的工作原理,否則TradingView不建议您付费或使用脚本。您还可以在我们的社区脚本中找到免费的开源替代方案。
作者的说明
Get in touch with us through communication method mentioned below signature field or go to our profile page and get connected through tradingview chat feature.
To avail FREE TRIAL for all our invite-only indicators, please contact us:
Telegram: @jellygill
Our Telegram Channel: @CheetaTrader
join to complete FREE TRAINING on how to use the indicators effectively and then request @jellygill for FREE TRIAL
Telegram: @jellygill
Our Telegram Channel: @CheetaTrader
join to complete FREE TRAINING on how to use the indicators effectively and then request @jellygill for FREE TRIAL
免责声明
这些信息和出版物并不意味着也不构成TradingView提供或认可的金融、投资、交易或其它类型的建议或背书。请在使用条款阅读更多信息。
仅限邀请脚本
只有经作者批准的用户才能访问此脚本。您需要申请并获得使用权限。该权限通常在付款后授予。如需了解更多详情,请按照以下作者的说明操作,或直接联系jellygill。
除非您完全信任其作者并了解脚本的工作原理,否則TradingView不建议您付费或使用脚本。您还可以在我们的社区脚本中找到免费的开源替代方案。
作者的说明
Get in touch with us through communication method mentioned below signature field or go to our profile page and get connected through tradingview chat feature.
To avail FREE TRIAL for all our invite-only indicators, please contact us:
Telegram: @jellygill
Our Telegram Channel: @CheetaTrader
join to complete FREE TRAINING on how to use the indicators effectively and then request @jellygill for FREE TRIAL
Telegram: @jellygill
Our Telegram Channel: @CheetaTrader
join to complete FREE TRAINING on how to use the indicators effectively and then request @jellygill for FREE TRIAL
免责声明
这些信息和出版物并不意味着也不构成TradingView提供或认可的金融、投资、交易或其它类型的建议或背书。请在使用条款阅读更多信息。