OPEN-SOURCE SCRIPT
SMA Crossover Support & Resistance [Rami_LB]
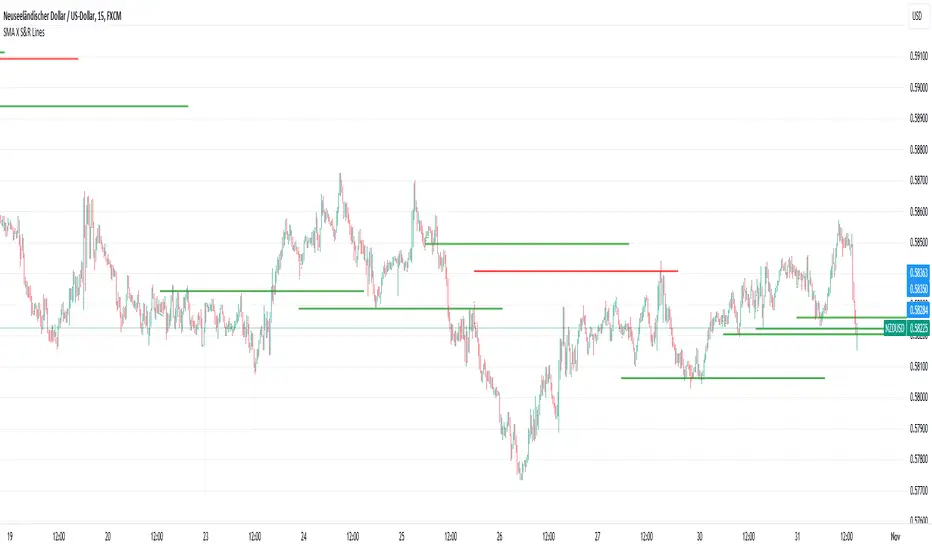
This indicator draws a horizontal line on the price chart at the point where two pre-defined SMA (Simple Moving Average) lines intersect. It is most useful for identifying crossed SMA lines on the 1-hour chart and then trading on smaller chart intervals.
For optimal performance, it is recommended to customize the values of the SMA lines individually for each currency pair, as these values can vary from one pair to another. To do this, switch to the 1-hour chart and adjust the SMA parameters until you visually observe that these settings would yield favorable results based on historical data. Certainly, you can also adjust the length of the lines accordingly when you switch from the 1-hour chart to smaller timeframes.
Please note that this indicator allows traders to visually identify potential trend changes and crossovers between short-term and long-term moving averages, aiding in decision-making for trading strategies.
开源脚本
秉承TradingView的精神,该脚本的作者将其开源,以便交易者可以查看和验证其功能。向作者致敬!您可以免费使用该脚本,但请记住,重新发布代码须遵守我们的网站规则。
免责声明
这些信息和出版物并非旨在提供,也不构成TradingView提供或认可的任何形式的财务、投资、交易或其他类型的建议或推荐。请阅读使用条款了解更多信息。
免责声明
这些信息和出版物并非旨在提供,也不构成TradingView提供或认可的任何形式的财务、投资、交易或其他类型的建议或推荐。请阅读使用条款了解更多信息。