OPEN-SOURCE SCRIPT
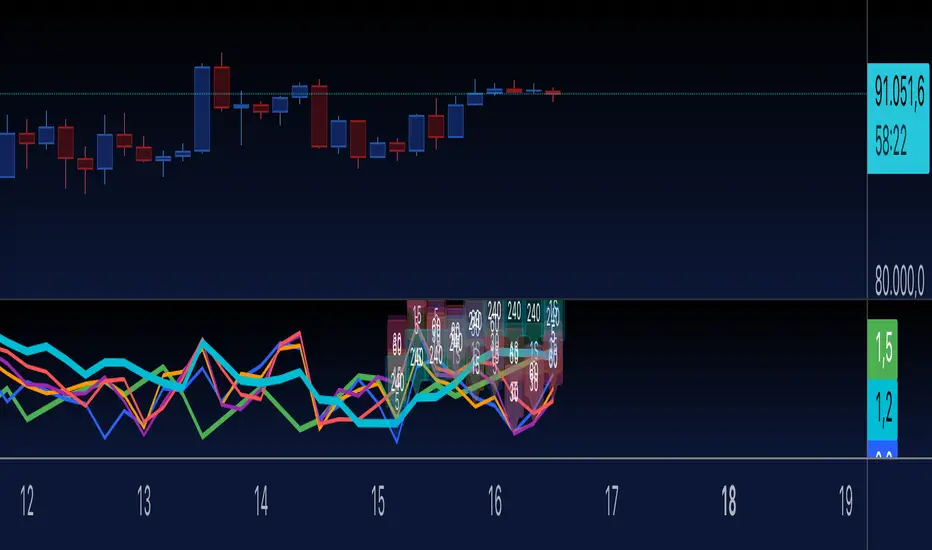
Multi-LTF Fisher Transform -AYNET

John F. Ehlers is a renowned figure in the field of financial markets and technical analysis. With a strong background in engineering and digital signal processing (DSP), Ehlers has applied his expertise to the development of innovative technical indicators and trading systems. His work focuses on using mathematical concepts, particularly those from signal processing, to analyze financial data. THANKS.
Simple Explanation of the Code
This Pine Script code calculates and plots Fisher Transform values for up to 6 different timeframes. The user can enable or disable each timeframe, and each Fisher Transform line is displayed in a unique color. Labels at the end of the lines indicate the timeframe.
Key Components of the Code
User Inputs:
Timeframes: The user specifies up to 6 different timeframes (ltf_1, ltf_2, etc.).
Enable/Disable Options: The user can choose which timeframes to enable using checkboxes (enable_1, enable_2, etc.).
Fisher Transform Length: The number of periods (fisher_length) used to calculate the Fisher Transform.
Fisher Transform Calculation:
For each enabled timeframe, the Fisher Transform is calculated using the fisher_transform_func() function:
Lowest Low and Highest High over the given period are fetched.
The Fisher Transform formula normalizes the price and transforms it into an oscillating value.
Dynamic Plotting:
Each Fisher Transform is plotted in a unique color if the corresponding timeframe is enabled.
Labels are added at the end of the lines to indicate the timeframe (e.g., "15m", "1H").
Visual Enhancements:
Unique colors for each line (green, blue, orange, etc.).
Labels dynamically display the timeframe names.
What the Code Does
Calculates Fisher Transform:
For example, for a 15m timeframe:
Finds the lowest low and highest high over the specified period.
Applies the Fisher Transform formula to normalize and smooth the values.
Plots Active Timeframes:
Only the enabled timeframes are plotted.
Each enabled Fisher Transform is plotted as a separate line.
Adds Labels:
At the end of each plotted line, a label indicates which timeframe it represents.
How It Looks
Each active timeframe is displayed as a colored oscillating line on the chart.
Labels like "15m" or "1H" appear at the end of the lines.
Inactive timeframes are not shown.
User Interaction
Input Parameters:
Select the desired timeframes (e.g., "15m", "1H", "4H").
Enable or disable specific timeframes.
Adjust the Fisher Transform period length.
Output:
View Fisher Transform lines for active timeframes.
Use labels to identify which line corresponds to which timeframe.
Why It’s Useful
Multi-Timeframe Analysis:
Helps compare momentum across different timeframes.
Customizable:
Users can enable only the timeframes they want.
Visual Clarity:
Unique colors and labels make it easy to distinguish between timeframes.
If you need further simplifications or more details, feel free to ask! 😊
开源脚本
秉承TradingView的精神,该脚本的作者将其开源,以便交易者可以查看和验证其功能。向作者致敬!您可以免费使用该脚本,但请记住,重新发布代码须遵守我们的网站规则。
免责声明
这些信息和出版物并非旨在提供,也不构成TradingView提供或认可的任何形式的财务、投资、交易或其他类型的建议或推荐。请阅读使用条款了解更多信息。
开源脚本
秉承TradingView的精神,该脚本的作者将其开源,以便交易者可以查看和验证其功能。向作者致敬!您可以免费使用该脚本,但请记住,重新发布代码须遵守我们的网站规则。
免责声明
这些信息和出版物并非旨在提供,也不构成TradingView提供或认可的任何形式的财务、投资、交易或其他类型的建议或推荐。请阅读使用条款了解更多信息。