OPEN-SOURCE SCRIPT
Strong Levels (Safe Version)
Strong Levels (Safe Version)
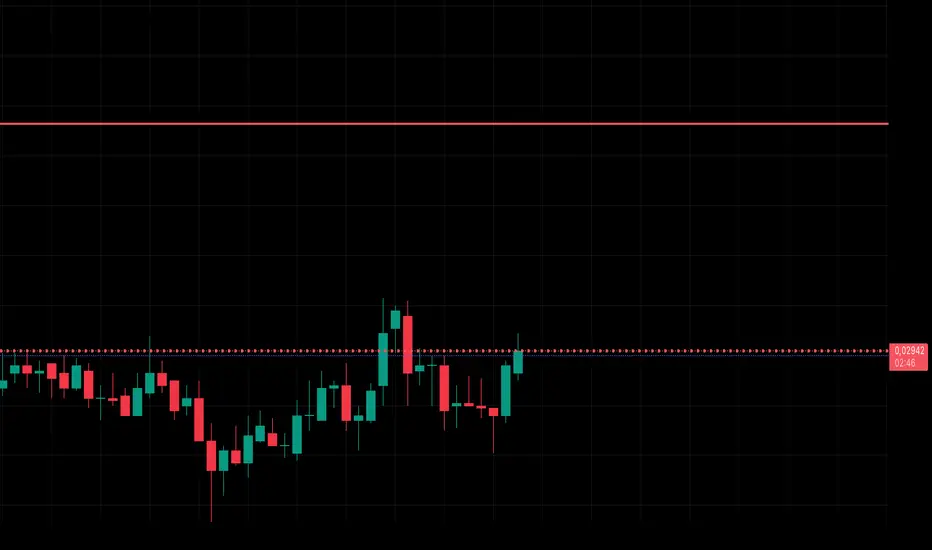
This indicator automatically detects and plots strong support and resistance levels based on pivot highs/lows and the number of touches. It’s designed to highlight only the most reliable levels by filtering with ATR tolerance and minimum touch requirements.
Features:
Detects pivot-based support and resistance zones
Adjustable left/right candles for pivot sensitivity
Minimum touches filter to confirm significant levels
ATR-based tolerance for flexible clustering of nearby levels
Maximum levels limit for cleaner charts
Automatic color coding (teal = support, red = resistance)
Safe version with optimized handling of line objects (up to 500 lines)
Parameters:
Left / Right candles – sensitivity of pivot detection
Min. touches – minimum confirmations required to display a level
ATR period & multiplier – tolerance range for grouping nearby levels
Max levels – limits the number of active levels
Colors – customize support and resistance lines
Usage:
This tool helps traders quickly identify the strongest price levels where market reactions are most likely. Use it to find high-probability entry, exit, or stop-loss zones in any market and timeframe.
开源脚本
本着TradingView的真正精神,此脚本的创建者将其开源,以便交易者可以查看和验证其功能。向作者致敬!虽然您可以免费使用它,但请记住,重新发布代码必须遵守我们的网站规则。
免责声明
这些信息和出版物并不意味着也不构成TradingView提供或认可的金融、投资、交易或其它类型的建议或背书。请在使用条款阅读更多信息。
开源脚本
本着TradingView的真正精神,此脚本的创建者将其开源,以便交易者可以查看和验证其功能。向作者致敬!虽然您可以免费使用它,但请记住,重新发布代码必须遵守我们的网站规则。
免责声明
这些信息和出版物并不意味着也不构成TradingView提供或认可的金融、投资、交易或其它类型的建议或背书。请在使用条款阅读更多信息。