OPEN-SOURCE SCRIPT
Multi Timeframe EMA
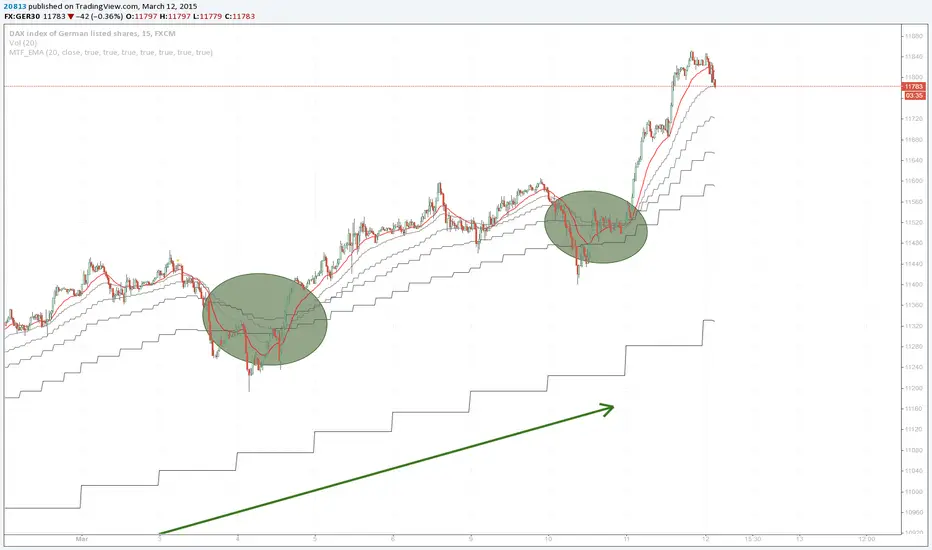
This indicator will show you the exponantial moving average (ema) of the higher timeframes (up to 1D). Current timeframe is colored red, higher timeframes are colored from light to dark gray (you can change this).
How to Trade this:
1. Look for tranding ema on higher timeframe (line is stepping up).
2. Look for faster time frames to pull back (decline) to a higher timeframe.
3. This is a good area to look for a buy entry (vice versa for sell entry).
Don't fight the trend :)
Updated Version: tradingview.com/v/j3RNOf5O/
开源脚本
秉承TradingView的精神,该脚本的作者将其开源,以便交易者可以查看和验证其功能。向作者致敬!您可以免费使用该脚本,但请记住,重新发布代码须遵守我们的网站规则。
免责声明
这些信息和出版物并非旨在提供,也不构成TradingView提供或认可的任何形式的财务、投资、交易或其他类型的建议或推荐。请阅读使用条款了解更多信息。
免责声明
这些信息和出版物并非旨在提供,也不构成TradingView提供或认可的任何形式的财务、投资、交易或其他类型的建议或推荐。请阅读使用条款了解更多信息。