OPEN-SOURCE SCRIPT
已更新 Hi-Lo-Gauges

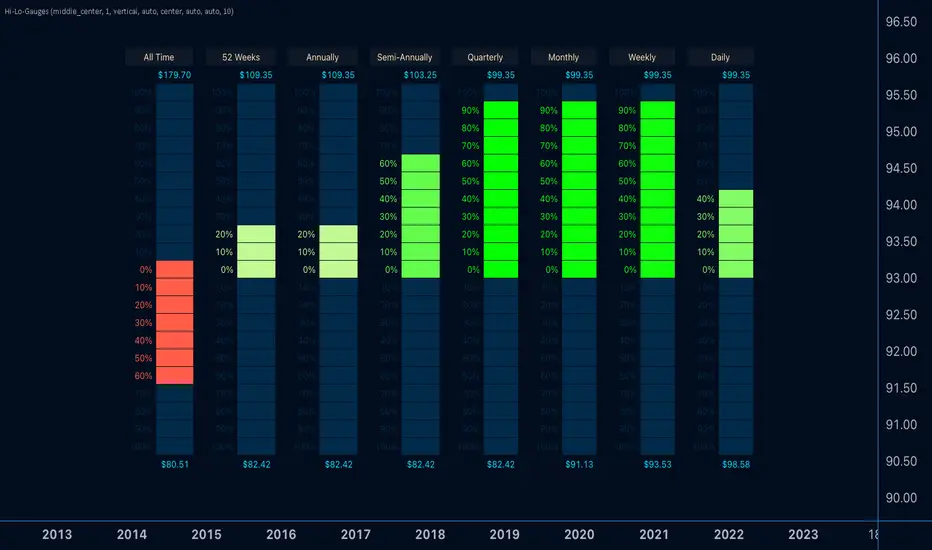
Introducing the 'Hi-Lo-Gauges' indicator, a powerful tool designed to provide a comprehensive visual representation of key price metrics. This indicator leverages up to 8 preset gauges, each catering to a specific aspect of market data:
Users have the flexibility to choose all 8 or selectively display specific gauges. For each metric, the gauge dynamically adapts, with the low value set as the minimum and the high value as the maximum. Measurement options include utilizing the highest and lowest closes or the literal highest and lowest prices.
The active price of the underlying asset serves as the reference point, allowing users to gauge the percentage move on the scale between the chosen minimum and maximum. Complete customization is at the users' fingertips, enabling them to tailor the indicator's appearance to suit their preferences.
With 'Hi-Lo-Gauges,' traders and analysts can intuitively monitor and interpret diverse price metrics, fostering a deeper understanding of market dynamics and supporting more informed decision-making.
Note: 'Hi-Lo-Gauges' is visible and applicable exclusively on the daily timeframe due to the nature of the metrics used.
- All-time high and low
- Current 52 Weeks high and low
- Current Annual High and Low
- Current Semi-Annual High and Low
- Current Quarterly High and Low
- Current Monthly High and Low
- Current Weekly High and Low
- Current Daily High and Low
Users have the flexibility to choose all 8 or selectively display specific gauges. For each metric, the gauge dynamically adapts, with the low value set as the minimum and the high value as the maximum. Measurement options include utilizing the highest and lowest closes or the literal highest and lowest prices.
The active price of the underlying asset serves as the reference point, allowing users to gauge the percentage move on the scale between the chosen minimum and maximum. Complete customization is at the users' fingertips, enabling them to tailor the indicator's appearance to suit their preferences.
With 'Hi-Lo-Gauges,' traders and analysts can intuitively monitor and interpret diverse price metrics, fostering a deeper understanding of market dynamics and supporting more informed decision-making.
Note: 'Hi-Lo-Gauges' is visible and applicable exclusively on the daily timeframe due to the nature of the metrics used.
版本注释
Bug:The weekly calculation was causing NaN value when reached Sunday. Solved: Issue resolved with correct calculation of milliseconds.
版本注释
Versions updated for imported libraries, and minor formatting fix.版本注释
Indicator visibility updated to timeframes daily and above. 版本注释
Updated: Imported libraries version update开源脚本
秉承TradingView的精神,该脚本的作者将其开源,以便交易者可以查看和验证其功能。向作者致敬!您可以免费使用该脚本,但请记住,重新发布代码须遵守我们的网站规则。
Faiyaz Haider
免责声明
这些信息和出版物并非旨在提供,也不构成TradingView提供或认可的任何形式的财务、投资、交易或其他类型的建议或推荐。请阅读使用条款了解更多信息。
开源脚本
秉承TradingView的精神,该脚本的作者将其开源,以便交易者可以查看和验证其功能。向作者致敬!您可以免费使用该脚本,但请记住,重新发布代码须遵守我们的网站规则。
Faiyaz Haider
免责声明
这些信息和出版物并非旨在提供,也不构成TradingView提供或认可的任何形式的财务、投资、交易或其他类型的建议或推荐。请阅读使用条款了解更多信息。