PROTECTED SOURCE SCRIPT
已更新 Market Profile
This indicator is meant to be used on CME Group futures products.
This indicator is the market profile firstly developed by J. Peter Steidlmayer, and also described in J. Dalton's book Mind Over Markets.
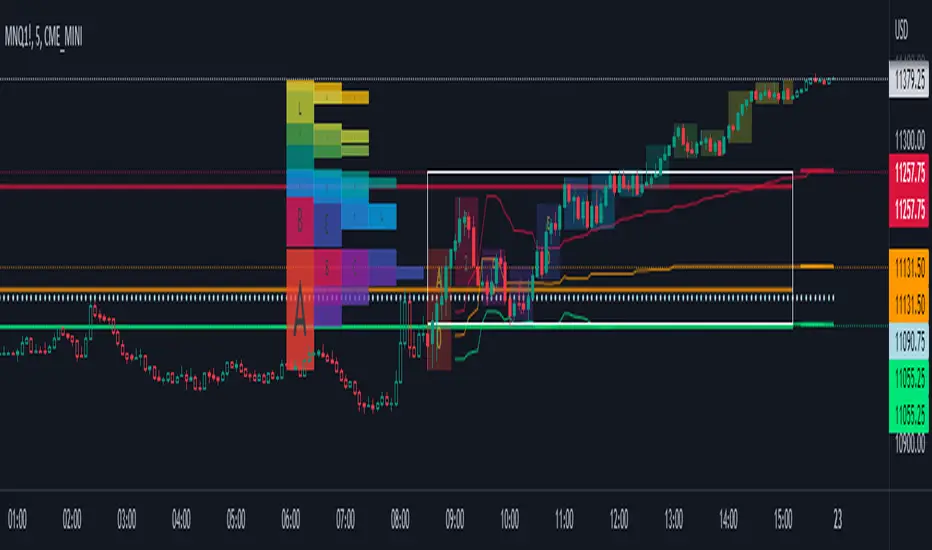
Each period is indicated by a color in the profile and overlayed on price by means of the bars of the same color, and the letter on top of it.
In addition to that, the rotation factor (see Mind over markets book) is indicated inside the 30min bar, under the letter.
It is possible to choose the session between different options. Each option changes the open and the close of the regular trading hours session.
It is possible to see the profile shifted on the left of the session open, or overlayed to the session.
The following plots are visible intraday:
Previous day's settlement price (white circles)
Previous day's Value high (red continuous)
Previous day's Point of control (orange continuous)
Previous day's Value low (green continuous)
Current day's Value high (red dashed)
Current day's Point of control (orange dashed)
Current day's Value low (green dashed)
Current day's value area is also highlighted by the light blue background.
If you would like to have your own custom version of this script, you can contact me privately.
Feel free to show your appreciation by donating:
BTC: bc1qs60uqsl0mxls8updnghzawl0vdfex72c9nzzgg
ETH: 0x7Cf5d904Cb88c97504863D6BE9ABBb7E3F806d6d
TetherUSD: 0x7Cf5d904Cb88c97504863D6BE9ABBb7E3F806d6d
USD Coin: 0x7Cf5d904Cb88c97504863D6BE9ABBb7E3F806d6d
This indicator is the market profile firstly developed by J. Peter Steidlmayer, and also described in J. Dalton's book Mind Over Markets.
Each period is indicated by a color in the profile and overlayed on price by means of the bars of the same color, and the letter on top of it.
In addition to that, the rotation factor (see Mind over markets book) is indicated inside the 30min bar, under the letter.
It is possible to choose the session between different options. Each option changes the open and the close of the regular trading hours session.
It is possible to see the profile shifted on the left of the session open, or overlayed to the session.
The following plots are visible intraday:
Previous day's settlement price (white circles)
Previous day's Value high (red continuous)
Previous day's Point of control (orange continuous)
Previous day's Value low (green continuous)
Current day's Value high (red dashed)
Current day's Point of control (orange dashed)
Current day's Value low (green dashed)
Current day's value area is also highlighted by the light blue background.
If you would like to have your own custom version of this script, you can contact me privately.
Feel free to show your appreciation by donating:
BTC: bc1qs60uqsl0mxls8updnghzawl0vdfex72c9nzzgg
ETH: 0x7Cf5d904Cb88c97504863D6BE9ABBb7E3F806d6d
TetherUSD: 0x7Cf5d904Cb88c97504863D6BE9ABBb7E3F806d6d
USD Coin: 0x7Cf5d904Cb88c97504863D6BE9ABBb7E3F806d6d
版本注释
removed a dummy input版本注释
minor adjustments to profile visualization版本注释
- corrected bug in the calculation of the profile
- added visualization of developing value area and point of control, and respective input on/off
- added value area percentage input
版本注释
added custom session time input版本注释
printing algorithm of the profile was updated版本注释
minor bug受保护脚本
此脚本以闭源形式发布。 但是,您可以自由使用,没有任何限制 — 了解更多信息这里。
免责声明
这些信息和出版物并非旨在提供,也不构成TradingView提供或认可的任何形式的财务、投资、交易或其他类型的建议或推荐。请阅读使用条款了解更多信息。
受保护脚本
此脚本以闭源形式发布。 但是,您可以自由使用,没有任何限制 — 了解更多信息这里。
免责声明
这些信息和出版物并非旨在提供,也不构成TradingView提供或认可的任何形式的财务、投资、交易或其他类型的建议或推荐。请阅读使用条款了解更多信息。