OPEN-SOURCE SCRIPT
已更新 Entry Buy/Sell with Adjustable EMA-WMA Difference by Brian Le
The "Entry Buy/Sell with RSI-WMA Conditions" script, crafted by Brian Le, is a specialized TradingView indicator designed for traders who seek to capitalize on specific RSI (Relative Strength Index) crossover events relative to key moving averages, specifically the EMA (Exponential Moving Average) and WMA (Weighted Moving Average). This tool is particularly useful for identifying potential entry points in a trading strategy, marked by distinctive visual signals on the chart.
Key Features:
Customizable Timeframes and Lengths: Users can adjust the lengths of the RSI, EMA, and WMA, making the indicator versatile across various timeframes and trading styles.
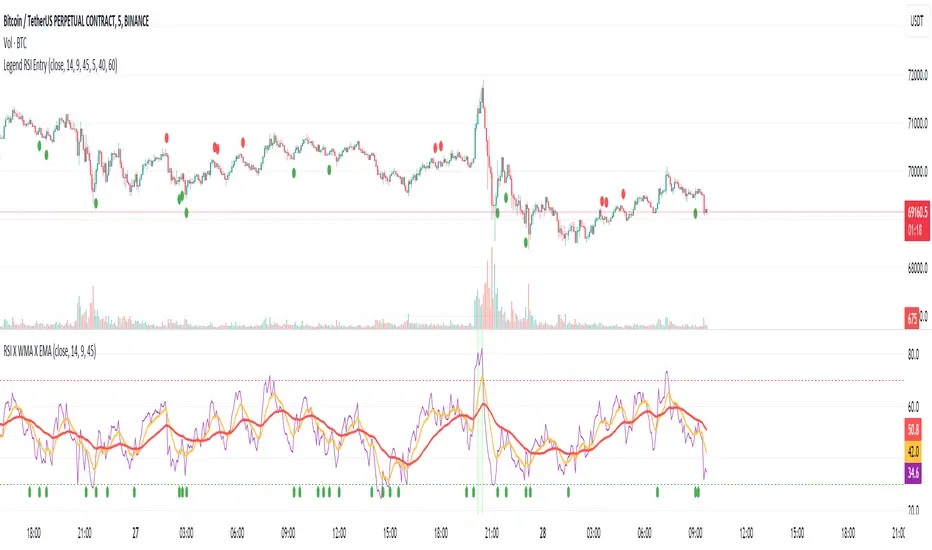
RSI Crossover Signals: The script generates signals based on the RSI crossing over the EMA. A green dot signifies a potential buy signal when the RSI crosses above the EMA, while a red dot indicates a potential sell signal when the RSI crosses below the EMA.
Special Conditions Based on WMA: The indicator enhances decision-making by including the WMA in its analysis. Buy signals (green dots) are only shown when the RSI is below the WMA, and sell signals (red dots) are displayed when the RSI is above the WMA. This additional condition helps in filtering out less probable trades.
EMA and WMA Difference Filter: A unique feature of this script is the ability to set a minimum point difference between the EMA and WMA, adding another layer of specificity to the generated signals.
RSI Threshold Filters: The indicator includes optional filters to show signals only when the RSI is above 40 (for buy signals) or below 60 (for sell signals), aiding in avoiding overbought or oversold conditions.
Enhanced Visuals for Significant Events: For more prominent trading events, such as the RSI crossing both the EMA and WMA within a single candle, the script plots larger symbols (triangles), making these significant events stand out on the chart.
Key Features:
Customizable Timeframes and Lengths: Users can adjust the lengths of the RSI, EMA, and WMA, making the indicator versatile across various timeframes and trading styles.
RSI Crossover Signals: The script generates signals based on the RSI crossing over the EMA. A green dot signifies a potential buy signal when the RSI crosses above the EMA, while a red dot indicates a potential sell signal when the RSI crosses below the EMA.
Special Conditions Based on WMA: The indicator enhances decision-making by including the WMA in its analysis. Buy signals (green dots) are only shown when the RSI is below the WMA, and sell signals (red dots) are displayed when the RSI is above the WMA. This additional condition helps in filtering out less probable trades.
EMA and WMA Difference Filter: A unique feature of this script is the ability to set a minimum point difference between the EMA and WMA, adding another layer of specificity to the generated signals.
RSI Threshold Filters: The indicator includes optional filters to show signals only when the RSI is above 40 (for buy signals) or below 60 (for sell signals), aiding in avoiding overbought or oversold conditions.
Enhanced Visuals for Significant Events: For more prominent trading events, such as the RSI crossing both the EMA and WMA within a single candle, the script plots larger symbols (triangles), making these significant events stand out on the chart.
版本注释
AddedCustom RSI Buy and Sell Levels: Users can now specify custom RSI levels for buy and sell conditions. This allows for more precise control over the entry signals based on RSI values.
Added input rsi_buy_level to set the RSI threshold for buy conditions.
Added input rsi_sell_level to set the RSI threshold for sell conditions.
Modified
Final Buy and Sell Conditions: Adjusted the logic for final buy and sell conditions to utilize the new custom RSI buy and sell levels if the respective RSI filter is enabled.
finalBuyCondition now checks rsi > rsi_buy_level instead of a fixed value of rsi > 40.
finalSellCondition now checks rsi < rsi_sell_level instead of a fixed value of rsi < 60.
开源脚本
秉承TradingView的精神,该脚本的作者将其开源,以便交易者可以查看和验证其功能。向作者致敬!您可以免费使用该脚本,但请记住,重新发布代码须遵守我们的网站规则。
免责声明
这些信息和出版物并非旨在提供,也不构成TradingView提供或认可的任何形式的财务、投资、交易或其他类型的建议或推荐。请阅读使用条款了解更多信息。
开源脚本
秉承TradingView的精神,该脚本的作者将其开源,以便交易者可以查看和验证其功能。向作者致敬!您可以免费使用该脚本,但请记住,重新发布代码须遵守我们的网站规则。
免责声明
这些信息和出版物并非旨在提供,也不构成TradingView提供或认可的任何形式的财务、投资、交易或其他类型的建议或推荐。请阅读使用条款了解更多信息。