OPEN-SOURCE SCRIPT
ZigZag Bands
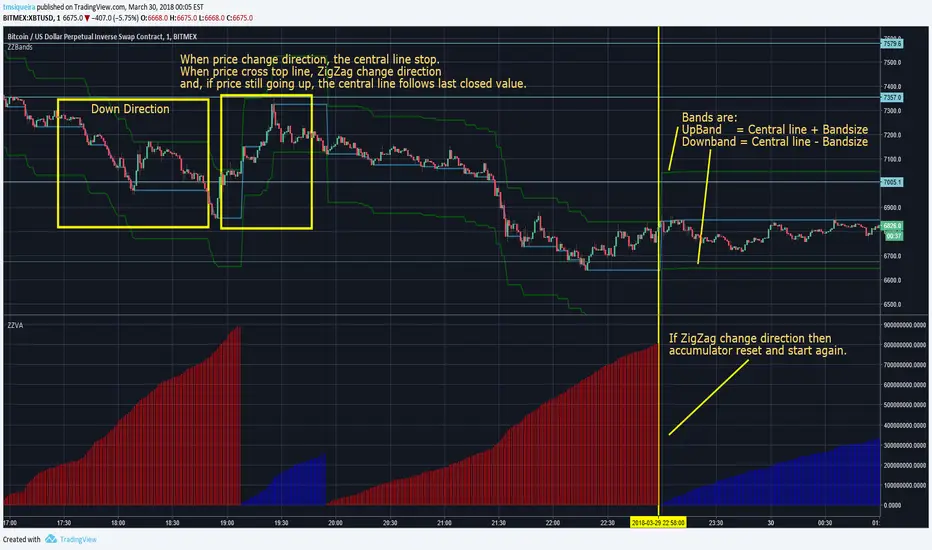
This script plots a central line and top and bottom lines, like a bands.
If the market is up and price still going up then central line follow the last closed "close" value.
If the market is up and price goes down, then central line stop change. If price still going down and cross bottom line, the direction changes and central line start to follow the close value if it is below central line.
I recommend to use Bandsize = 2 or 3 times ATR(300 or bigger)
This script is used in pair with my ZigZag Volume Accumulator, https://br.tradingview.com/script/Zplglw8b/
开源脚本
秉承TradingView的精神,该脚本的作者将其开源,以便交易者可以查看和验证其功能。向作者致敬!您可以免费使用该脚本,但请记住,重新发布代码须遵守我们的网站规则。
免责声明
这些信息和出版物并非旨在提供,也不构成TradingView提供或认可的任何形式的财务、投资、交易或其他类型的建议或推荐。请阅读使用条款了解更多信息。
开源脚本
秉承TradingView的精神,该脚本的作者将其开源,以便交易者可以查看和验证其功能。向作者致敬!您可以免费使用该脚本,但请记住,重新发布代码须遵守我们的网站规则。
免责声明
这些信息和出版物并非旨在提供,也不构成TradingView提供或认可的任何形式的财务、投资、交易或其他类型的建议或推荐。请阅读使用条款了解更多信息。