PROTECTED SOURCE SCRIPT
已更新 MONEY ZONE
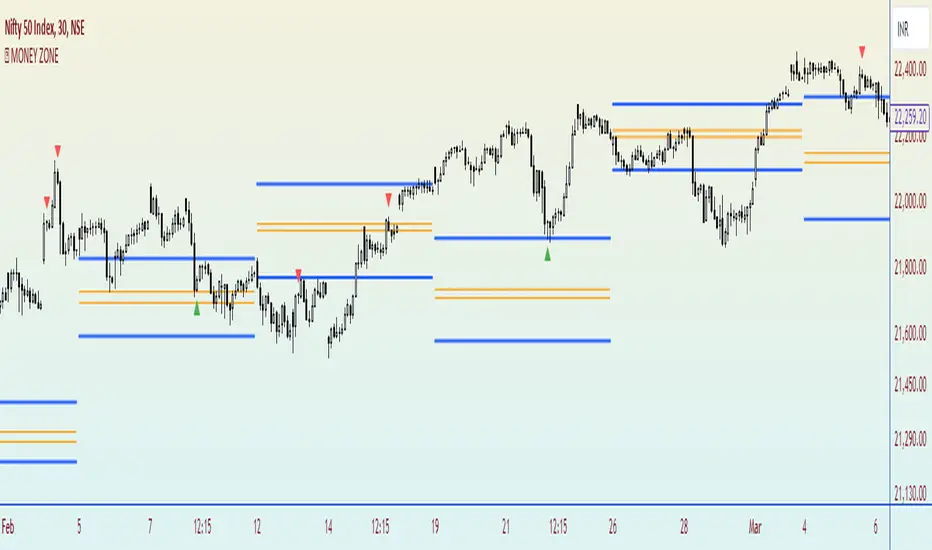
A volume profile is an advanced charting tool that displays the traded volume at different price levels over a specific period. It helps you visualize where the majority of trading activity has occurred.
This indicator is a Market Profiling tool used to analyse the Point of Control (POC) and Value Area (VAH/VAL) on the daily, weekly and monthly timeframes. It also optionally displays historical Value Areas to help find confluence with past data.
The Point of Control describes the price level where the most volume was traded. A Naked Point of Control (also called a Virgin Point of Control) is a previous POC that has not been traded.
The Value Area is a range of prices where the majority of trading volume took place on the prior trading day. In specific, this area is the range where 70% of the prior day’s volume happened. The value area is approximately one standard deviation above and below the average highest volume price. With this knowledge, there are specific probabilities of market behavior we can understand to digest the value area. The value area gives us an idea of where the smart money is playing ball and where the institutions are guiding the market. From this data, we can derive intra-day strategies that capitalize on market behavior.
🔹 Point of Control (PoC)
Point of Control (POC) – The price level for the time period with the highest traded volume
🔹 Value Area (VA)
Value Area (VA) – The range of price levels in which the specified percentage of all volume was traded during the time period.
版本注释
Bugs Removed.版本注释
Bugs fixed.版本注释
updated.版本注释
Reversal Signals printing on.版本注释
Bugs Removed As well as signals removed from the settings.版本注释
AUTO Time line improved. now can see same level above 5min chart timeframe.受保护脚本
此脚本以闭源形式发布。 但是,您可以自由使用,没有任何限制 — 了解更多信息这里。
免责声明
这些信息和出版物并非旨在提供,也不构成TradingView提供或认可的任何形式的财务、投资、交易或其他类型的建议或推荐。请阅读使用条款了解更多信息。
受保护脚本
此脚本以闭源形式发布。 但是,您可以自由使用,没有任何限制 — 了解更多信息这里。
免责声明
这些信息和出版物并非旨在提供,也不构成TradingView提供或认可的任何形式的财务、投资、交易或其他类型的建议或推荐。请阅读使用条款了解更多信息。