OPEN-SOURCE SCRIPT
💸 Monetary Momentum Oscillator (MMO)
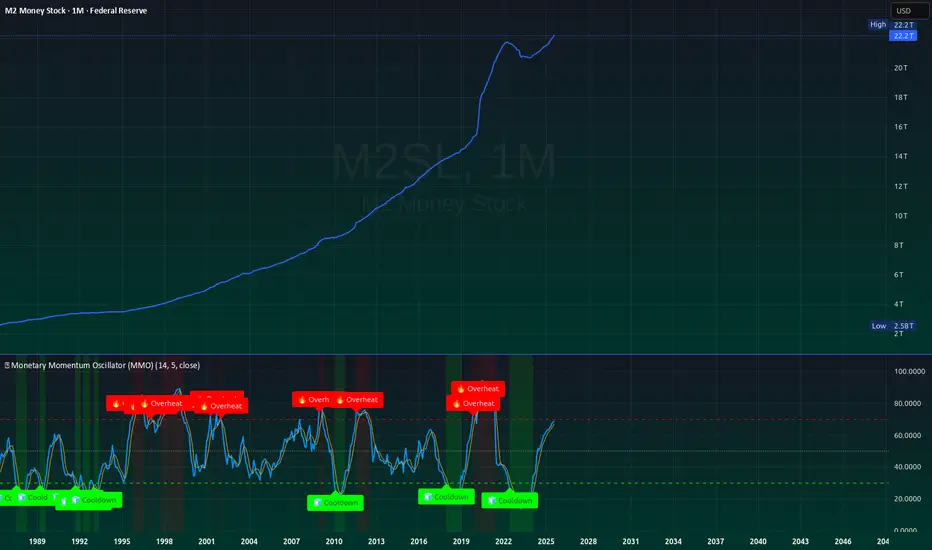
Monetary Momentum Oscillator (MMO)
The Monetary Momentum Oscillator (MMO) measures the rate of change in the money supply (like M2, Fed Balance Sheet, or similar macro series) and applies a momentum-based RSI calculation to visualize liquidity acceleration and deceleration.
💡 Purpose:
MMO is designed for macro-level analysis — it identifies when monetary expansion is overheating (potential inflation or risk-on conditions) and when contraction is cooling off (liquidity tightening or deflationary stress).
📊 How It Works:
Calculates the percentage change of the selected data source over a chosen lookback period.
Applies an RSI transformation to visualize momentum extremes.
Overlays signal smoothing and highlights overheat/cooldown zones.
🔍 Interpretation:
Above 70 → Liquidity acceleration / overheating (potential inflationary impulse).
Below 30 → Liquidity deceleration / contraction (risk-off, tightening).
Crossovers → Momentum shifts that often precede macro trend reversals in risk assets.
⚙️ Best Used On:
Macroeconomic series such as M2SL, M2V, WALCL, or custom liquidity indexes.
Long-term charts (weekly or monthly) for detecting major monetary regime transitions.
🧩 Core Idea:
Liquidity is the real market engine — this oscillator quantifies its pulse.
开源脚本
本着TradingView的真正精神,此脚本的创建者将其开源,以便交易者可以查看和验证其功能。向作者致敬!虽然您可以免费使用它,但请记住,重新发布代码必须遵守我们的网站规则。
免责声明
这些信息和出版物并不意味着也不构成TradingView提供或认可的金融、投资、交易或其它类型的建议或背书。请在使用条款阅读更多信息。
开源脚本
本着TradingView的真正精神,此脚本的创建者将其开源,以便交易者可以查看和验证其功能。向作者致敬!虽然您可以免费使用它,但请记住,重新发布代码必须遵守我们的网站规则。
免责声明
这些信息和出版物并不意味着也不构成TradingView提供或认可的金融、投资、交易或其它类型的建议或背书。请在使用条款阅读更多信息。