OPEN-SOURCE SCRIPT
[SS]_TrendAVGZones_and_GoldenRatioMA
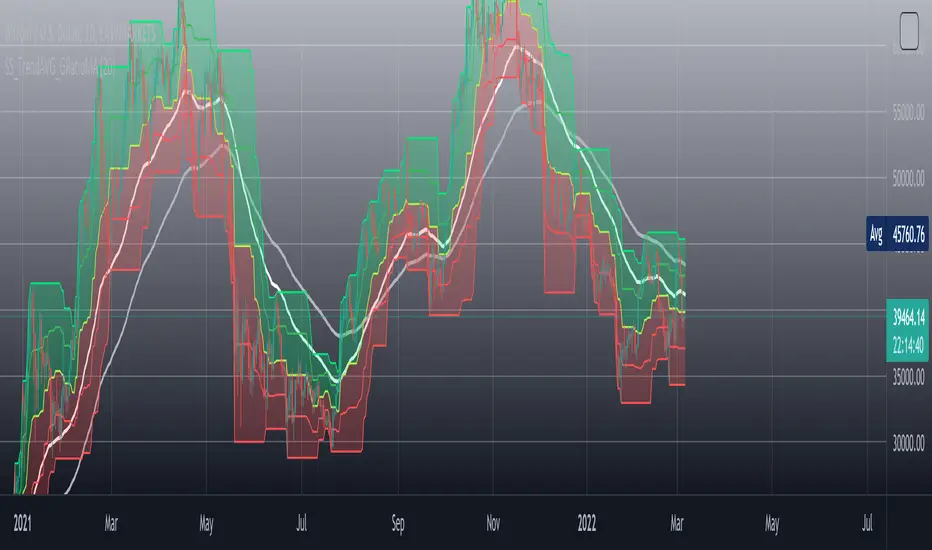
The [SS]_TrendAVGZones_and_GoldenRatioMA is an indicator that is composed first of a channel made of three price averages ( base average, middle lower and middle upper ) in red is the previous corrections average and in green the previous rises average. So that way we the setting of stop loss targets and price targets can be set up at first glance. It adjusts to any timeframe so no worries 'bout that.
Also I added two exponential moving averages ( white and silver lines ) on the chart which I modified their equations by multiplying as it follows :
[ Golden ratio EMA * rphi * phi ] is the simple modification I added to fine tune it's precision and after some trials and errors I finally found a perfect spot. Now I tried it with historical data of Bitcoin and when the two Golden Ratio EMA crosses there's a big move coming imminently : if the white one is on top of the silver one the trend is bullish inversely the white one finds itself under the silver line then it needs to cross to expect a reversal.
rphi = 0.6180339887498948 = is the conjugate root of the golden ratio also called the silver ratio
phi = 1.6180339887498948 = golden ratio
It should be used to find short to mid term price targets selling as well as buying ones. If you're a long term trader I suggest using trend lines analysis in combination with it.
I hope to make this indicator a community owned indicator so don't hesitate to perfect it so we can build the best tool traders can hope for ! Together we will no longer ask wen lambo? we will get it!
IF you've got any question you can always DM me
take care of yourselves you future millionaires :D
-SS
开源脚本
秉承TradingView的精神,该脚本的作者将其开源,以便交易者可以查看和验证其功能。向作者致敬!您可以免费使用该脚本,但请记住,重新发布代码须遵守我们的网站规则。
免责声明
这些信息和出版物并非旨在提供,也不构成TradingView提供或认可的任何形式的财务、投资、交易或其他类型的建议或推荐。请阅读使用条款了解更多信息。
开源脚本
秉承TradingView的精神,该脚本的作者将其开源,以便交易者可以查看和验证其功能。向作者致敬!您可以免费使用该脚本,但请记住,重新发布代码须遵守我们的网站规则。
免责声明
这些信息和出版物并非旨在提供,也不构成TradingView提供或认可的任何形式的财务、投资、交易或其他类型的建议或推荐。请阅读使用条款了解更多信息。