PROTECTED SOURCE SCRIPT
已更新 Probabilistic Trend Indicator
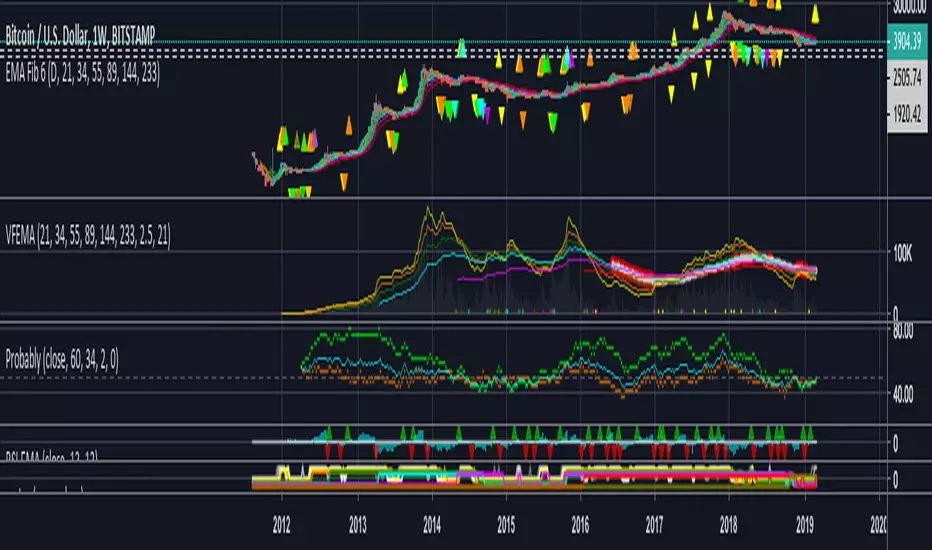
An indicator which attempts to assert the probability of the trend based on a given Sample Size and Look-Back Confirmation Size.
The green dots indicate the probability given to price.
The orange dots indicate the probability given to volume.
The aqua line is a weighted average between them.
The Sample Size is the number of candles to include in the entire calculation.
- This number should be higher to gather more data.
The Look-Back Confirmation Size is the number of candles to include, to confirm the current candles relative strength.
- This number should be lower to give a stronger closer relative reading.
Values above 50 indicate a strengthening position toward prices increasing.
- The strength of this value is weakly exponential and may max out around 80
Values below 50 indicate a strengthening position toward prices decreasing.
- The strength of this value is weakly exponential and may max out around 20
~ Enjoy!
版本注释
~ Updates default Sample Size to be slightly smaller+ Adds quality-of-life feature to smooth the Average (this is an EMA applied to the average line)
版本注释
NOTE: This indicator denotes the probability that the next candle will be greater than the previous (it does not denote the magnitude of how much greater it will be, just the likelihood).+ Adds the ability to change the source timeframe
版本注释
+ Adds the ability to gather samples from an alternative timeframe.+ Adds the ability to toggle the alternate timeframe setting.
+ Adds the ability to toggle the weighting of the average.
受保护脚本
此脚本以闭源形式发布。 但是,您可以自由使用,没有任何限制 — 了解更多信息这里。
免责声明
这些信息和出版物并非旨在提供,也不构成TradingView提供或认可的任何形式的财务、投资、交易或其他类型的建议或推荐。请阅读使用条款了解更多信息。
受保护脚本
此脚本以闭源形式发布。 但是,您可以自由使用,没有任何限制 — 了解更多信息这里。
免责声明
这些信息和出版物并非旨在提供,也不构成TradingView提供或认可的任何形式的财务、投资、交易或其他类型的建议或推荐。请阅读使用条款了解更多信息。