OPEN-SOURCE SCRIPT
Fat Tails Analyzer
🧠 Fat Tails Analyzer — Analysis of Anomalous ("Fat-Tailed") Movements
📌 Description
Fat Tails Analyzer is a tool for analyzing "fat tails" in the distribution of returns. Unlike normal distribution, financial markets often exhibit frequent extreme movements. This indicator identifies and visualizes such events by analyzing logarithmic returns, deviations from normal distribution, and excess kurtosis.
🔬 Methodology
Logarithmic returns (ln(Close / Close[1])) are calculated for accurate aggregation and symmetry.
Moving average and standard deviation of returns are computed over a specified period.
"Fat-tailed" events are identified when returns exceed μ ± k·σ, where k is user-defined.
Normal distribution bands (±2σ) and kurtosis (a measure of tail "heaviness") are displayed for clarity.
📊 What It Displays
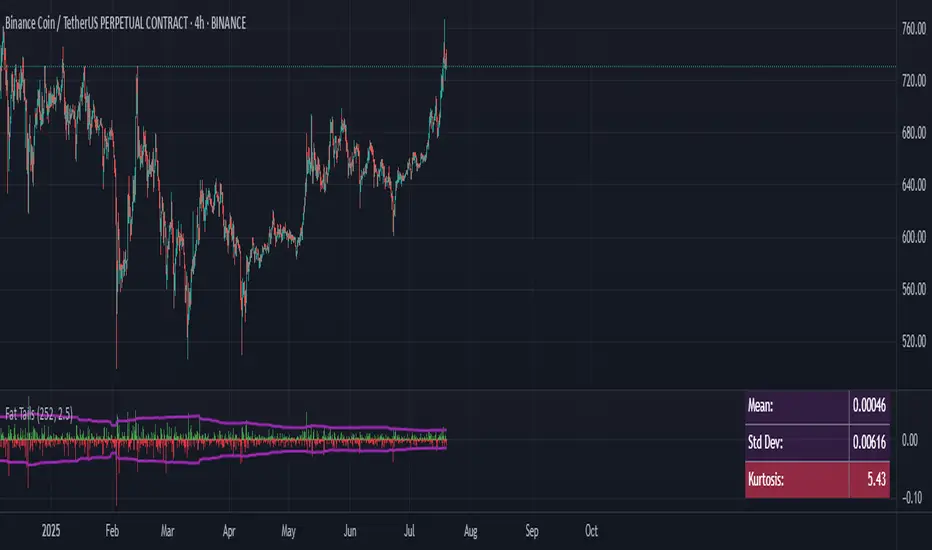
📈 Histogram of Returns: Green for positive, red for negative.
🟣 Fat Tail Threshold Lines: Marking extreme events.
⚪ Silver Normal Distribution Bands: ±2σ boundaries.
🔵 Kurtosis Line: If enabled.
📋 Table with Key Metrics: Mean, σ, kurtosis.
⚙️ Parameters
📌 Interpretation
Excess Kurtosis > 0: More extreme events than predicted by normal distribution.
Returns beyond fat-tail thresholds: Potential signals of panic, shock, or exceptional news.
Consistently high kurtosis: Unstable or speculative asset.
🧪 Applications
📉 Identify extreme risks in assets (especially cryptocurrencies and derivatives).
🧠 Study market behavior and dispersion.
🛡 Support risk analysis, stop-loss settings, and systemic risk assessment.
🔎 Compare assets by the "normality" of their behavior.
🧭 Live Metrics Table
Displayed in the bottom-right corner:
🧠 Good to Know
Normal distribution has kurtosis = 0.
> 0: "Fat tails" (more extreme values).
< 0: "Thin tails" (values close to the mean).
📌 Description
Fat Tails Analyzer is a tool for analyzing "fat tails" in the distribution of returns. Unlike normal distribution, financial markets often exhibit frequent extreme movements. This indicator identifies and visualizes such events by analyzing logarithmic returns, deviations from normal distribution, and excess kurtosis.
🔬 Methodology
Logarithmic returns (ln(Close / Close[1])) are calculated for accurate aggregation and symmetry.
Moving average and standard deviation of returns are computed over a specified period.
"Fat-tailed" events are identified when returns exceed μ ± k·σ, where k is user-defined.
Normal distribution bands (±2σ) and kurtosis (a measure of tail "heaviness") are displayed for clarity.
📊 What It Displays
📈 Histogram of Returns: Green for positive, red for negative.
🟣 Fat Tail Threshold Lines: Marking extreme events.
⚪ Silver Normal Distribution Bands: ±2σ boundaries.
🔵 Kurtosis Line: If enabled.
📋 Table with Key Metrics: Mean, σ, kurtosis.
⚙️ Parameters
- Lookback Period (Bars): Analysis period (default: 252).
- Fat Tail Threshold (Std Devs): Deviation for extreme events (k, default: 2.5).
- Show Normal Distribution Bands: Toggle ±2σ boundaries.
- Show Kurtosis: Enable kurtosis analysis mode.
📌 Interpretation
Excess Kurtosis > 0: More extreme events than predicted by normal distribution.
Returns beyond fat-tail thresholds: Potential signals of panic, shock, or exceptional news.
Consistently high kurtosis: Unstable or speculative asset.
🧪 Applications
📉 Identify extreme risks in assets (especially cryptocurrencies and derivatives).
🧠 Study market behavior and dispersion.
🛡 Support risk analysis, stop-loss settings, and systemic risk assessment.
🔎 Compare assets by the "normality" of their behavior.
🧭 Live Metrics Table
Displayed in the bottom-right corner:
- Mean return
- Standard deviation
- Excess kurtosis (color-coded by value)
🧠 Good to Know
Normal distribution has kurtosis = 0.
> 0: "Fat tails" (more extreme values).
< 0: "Thin tails" (values close to the mean).
开源脚本
秉承TradingView的精神,该脚本的作者将其开源,以便交易者可以查看和验证其功能。向作者致敬!您可以免费使用该脚本,但请记住,重新发布代码须遵守我们的网站规则。
免责声明
这些信息和出版物并非旨在提供,也不构成TradingView提供或认可的任何形式的财务、投资、交易或其他类型的建议或推荐。请阅读使用条款了解更多信息。
开源脚本
秉承TradingView的精神,该脚本的作者将其开源,以便交易者可以查看和验证其功能。向作者致敬!您可以免费使用该脚本,但请记住,重新发布代码须遵守我们的网站规则。
免责声明
这些信息和出版物并非旨在提供,也不构成TradingView提供或认可的任何形式的财务、投资、交易或其他类型的建议或推荐。请阅读使用条款了解更多信息。