PROTECTED SOURCE SCRIPT
RGTS_TrendPower V2.0
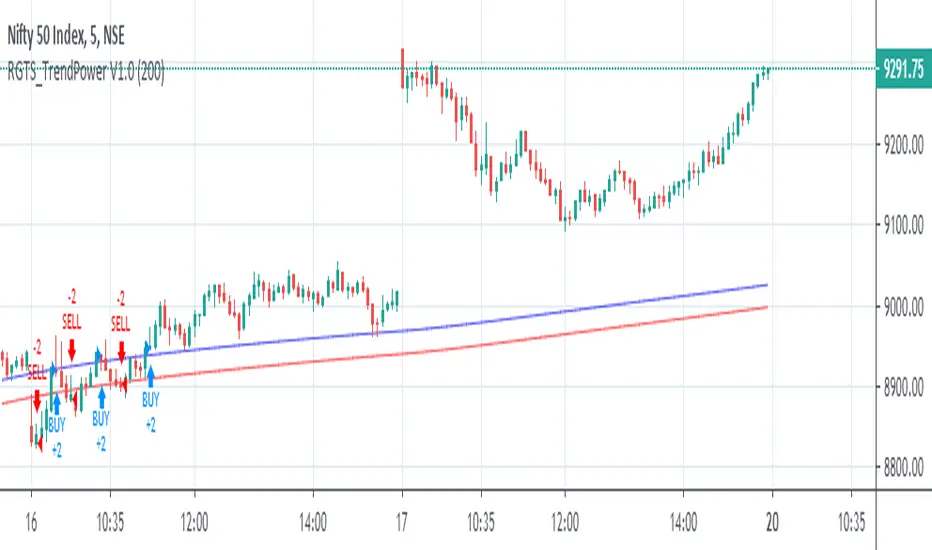
This Study is Based on High Low Band,
Buy-Sell Rules
Above Blue Line Trend Will Be Bullish, Buy Above Blue Line With Complet Breakout of Blueline
Below Blue Line Trend Wil Be Bearish, Sell Below Red Line With Complet Breakout of Red Line
Also, you can Change input From Setting to Check wich length Working fine for me,
I have Tested this Strategie in Indian Stock Market especially in NIFTY and BANKNIFTY index Future Trading
Speculation is Involved High Risk, Please test Strategie on Paper Before moving on Actual Trading
Thanks.
受保护脚本
此脚本以闭源形式发布。 但是,您可以自由使用,没有任何限制 — 了解更多信息这里。
免责声明
这些信息和出版物并非旨在提供,也不构成TradingView提供或认可的任何形式的财务、投资、交易或其他类型的建议或推荐。请阅读使用条款了解更多信息。
受保护脚本
此脚本以闭源形式发布。 但是,您可以自由使用,没有任何限制 — 了解更多信息这里。
免责声明
这些信息和出版物并非旨在提供,也不构成TradingView提供或认可的任何形式的财务、投资、交易或其他类型的建议或推荐。请阅读使用条款了解更多信息。