OPEN-SOURCE SCRIPT
Distance From moving average
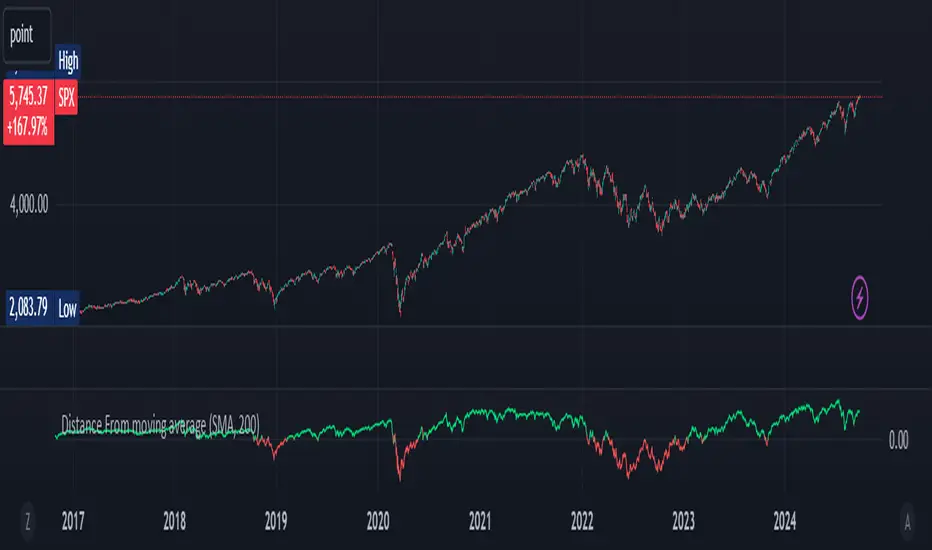
Distance From Moving Average is designed to help traders visualize the deviation of the current price from a specified moving average. Users can select from four different types of moving averages: Simple Moving Average (SMA), Exponential Moving Average (EMA), Weighted Moving Average (WMA), and Hull Moving Average (HMA).
Key Features:
User-Friendly Input Options:
Choose the type of moving average from a dropdown menu.
Set the length of the moving average, with a default value of 200.
Custom Moving Average Calculations:
The script computes the selected moving average using the appropriate mathematical formula, allowing for versatile analysis based on individual trading strategies.
Distance Calculation:
The indicator calculates the distance between the current price and the chosen moving average, providing insight into market momentum. A positive value indicates that the price is above the moving average, while a negative value shows it is below.
Visual Representation:
The distance is plotted on the chart, with color coding:
Lime: Indicates that the price is above the moving average (bullish sentiment).
Red: Indicates that the price is below the moving average (bearish sentiment).
Customization:
Users can further customize the appearance of the plotted line, enhancing clarity and visibility on the chart.
This indicator is particularly useful for traders looking to gauge market conditions and make informed decisions based on the relationship between current prices and key moving averages.
开源脚本
秉承TradingView的精神,该脚本的作者将其开源,以便交易者可以查看和验证其功能。向作者致敬!您可以免费使用该脚本,但请记住,重新发布代码须遵守我们的网站规则。
免责声明
这些信息和出版物并非旨在提供,也不构成TradingView提供或认可的任何形式的财务、投资、交易或其他类型的建议或推荐。请阅读使用条款了解更多信息。
免责声明
这些信息和出版物并非旨在提供,也不构成TradingView提供或认可的任何形式的财务、投资、交易或其他类型的建议或推荐。请阅读使用条款了解更多信息。