OPEN-SOURCE SCRIPT
已更新 Colored ADX with DI+/- and thresholds
Average Directional Index ( ADX )
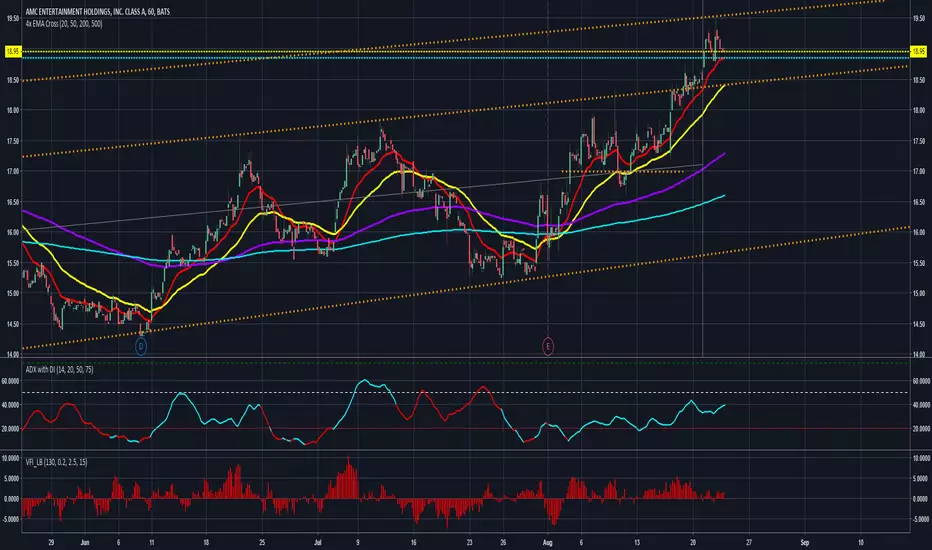
Based off of MasaNakamura's implementation, modified to show high & super-high momentum thresholds. In addition, coloring the trend line by the prevailing trend direction from the DI (Red if down, Green if up) allows you to remove the DI if you want to reduce chart clutter!
"The Average Directional Index (ADX), Minus Directional Indicator (-DI) and Plus Directional Indicator (+DI) represent a group of directional movement indicators that form a trading system developed by Welles Wilder....
The Plus Directional Indicator (+DI) and Minus Directional Indicator (-DI) are derived from smoothed averages of these differences, and measure trend direction over time. These two indicators are often referred to collectively as the Directional Movement Indicator (DMI).
The Average Directional Index (ADX) is in turn derived from the smoothed averages of the difference between +DI and -DI, and measures the strength of the trend (regardless of direction) over time.
Using these three indicators together, chartists can determine both the direction and strength of the trend....
At its most basic, the Average Directional Index (ADX) can be used to determine if a security is trending or not. This determination helps traders choose between a trend-following system or a non-trend-following system. Wilder suggests that a strong trend is present when ADX is above 20..."
See
investopedia.com/articles/trading/07/adx-trend-indicator.asp
stockcharts.com/school/doku.php?st=adx&id=chart_school:technical_indicators:average_directional_index_adx
for detail.
 AMD
AMD
There are more plans to add vertical lines on crosses and divergence indicators so stay tuned!
Thank you and good trading!
Based off of MasaNakamura's implementation, modified to show high & super-high momentum thresholds. In addition, coloring the trend line by the prevailing trend direction from the DI (Red if down, Green if up) allows you to remove the DI if you want to reduce chart clutter!
"The Average Directional Index (ADX), Minus Directional Indicator (-DI) and Plus Directional Indicator (+DI) represent a group of directional movement indicators that form a trading system developed by Welles Wilder....
The Plus Directional Indicator (+DI) and Minus Directional Indicator (-DI) are derived from smoothed averages of these differences, and measure trend direction over time. These two indicators are often referred to collectively as the Directional Movement Indicator (DMI).
The Average Directional Index (ADX) is in turn derived from the smoothed averages of the difference between +DI and -DI, and measures the strength of the trend (regardless of direction) over time.
Using these three indicators together, chartists can determine both the direction and strength of the trend....
At its most basic, the Average Directional Index (ADX) can be used to determine if a security is trending or not. This determination helps traders choose between a trend-following system or a non-trend-following system. Wilder suggests that a strong trend is present when ADX is above 20..."
See
investopedia.com/articles/trading/07/adx-trend-indicator.asp
stockcharts.com/school/doku.php?st=adx&id=chart_school:technical_indicators:average_directional_index_adx
for detail.
There are more plans to add vertical lines on crosses and divergence indicators so stay tuned!
Thank you and good trading!
版本注释
Added A color-correlation option to change colors based on the DI+/- to show the trend direction, or based on the threshold/magnitude of the trend开源脚本
秉承TradingView的精神,该脚本的作者将其开源,以便交易者可以查看和验证其功能。向作者致敬!您可以免费使用该脚本,但请记住,重新发布代码须遵守我们的网站规则。
免责声明
这些信息和出版物并非旨在提供,也不构成TradingView提供或认可的任何形式的财务、投资、交易或其他类型的建议或推荐。请阅读使用条款了解更多信息。
开源脚本
秉承TradingView的精神,该脚本的作者将其开源,以便交易者可以查看和验证其功能。向作者致敬!您可以免费使用该脚本,但请记住,重新发布代码须遵守我们的网站规则。
免责声明
这些信息和出版物并非旨在提供,也不构成TradingView提供或认可的任何形式的财务、投资、交易或其他类型的建议或推荐。请阅读使用条款了解更多信息。