PROTECTED SOURCE SCRIPT
已更新 ༒LIQUIDITY༒
🧠 Indicator Description: ༒LIQUIDITY༒
The ༒LIQUIDITY༒ indicator visualizes a dynamic liquidity and liquidation level heatmap based on changes in Open Interest (OI) from Binance futures markets.
It highlights precise areas where clusters of leveraged LONG and SHORT positions are likely to be liquidated, offering traders a clear view of liquidity zones.
---
⚙️ Key Features:
---
🧭 How to Read It:
---
💡 Usage Tips:
The ༒LIQUIDITY༒ indicator visualizes a dynamic liquidity and liquidation level heatmap based on changes in Open Interest (OI) from Binance futures markets.
It highlights precise areas where clusters of leveraged LONG and SHORT positions are likely to be liquidated, offering traders a clear view of liquidity zones.
---
⚙️ Key Features:
- 📉 Liquidity Heatmap: Displays potential liquidation levels derived from Open Interest data.
- ⚡ Three customizable leverage levels to detect high and low liquidation ranges.
- 🧩 Intrabar resolution control for multi-timeframe analysis (1m, 5m, 15m, etc.).
- 🎚️ Signal filtering (optional): Focus on significant Open Interest spikes only.
- 🎨 Progressive color gradient: Colors change according to contract size, creating a clear heatmap of risk clusters.
- 🔔 Built-in alerts when LONG or SHORT clusters get swept by price action.
---
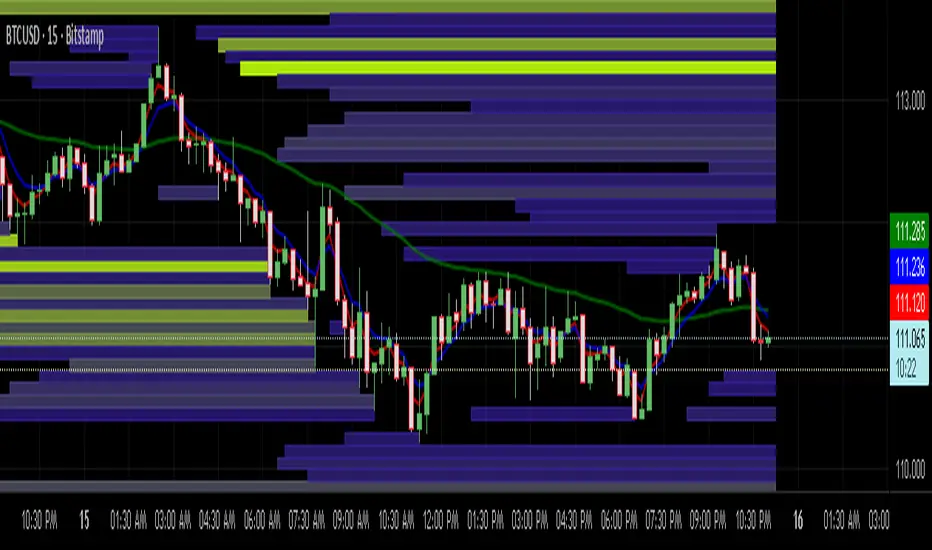
🧭 How to Read It:
- Green/Yellow zones: Indicate areas with a high concentration of LONG liquidations, potential downside liquidity targets.
- Blue/Purple zones: Show SHORT liquidation clusters, often acting as upside liquidity targets.
- The more intense the color, the greater the contract volume at that price level.
---
💡 Usage Tips:
- Best combined with Smart Money Concepts (SMC) tools, Order Blocks, or Fair Value Gaps (FVG).
- Recommended for timeframes between 5 minutes and 1 hour for optimal clarity and performance.
- Adjust the scale and dispersion factor to fine-tune the map’s precision and visual clarity.
版本注释
Se agrega la función parametro intrabar autómatico受保护脚本
此脚本以闭源形式发布。 但是,您可以自由使用它,没有任何限制 — 在此处了解更多信息。
免责声明
这些信息和出版物并不意味着也不构成TradingView提供或认可的金融、投资、交易或其它类型的建议或背书。请在使用条款阅读更多信息。
免责声明
这些信息和出版物并不意味着也不构成TradingView提供或认可的金融、投资、交易或其它类型的建议或背书。请在使用条款阅读更多信息。