OPEN-SOURCE SCRIPT
High Minus Low

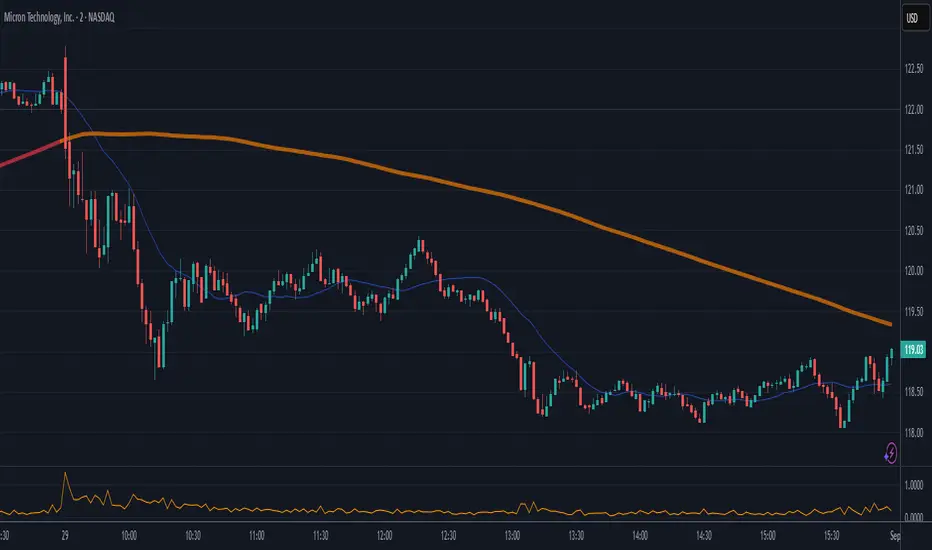
This indicator is a simple yet powerful tool for technical analysis. It measures the range of each candlestick by calculating the difference between its high and low, providing a direct visualization of market volatility.
Key Features:
Volatility at a Glance: The plot's height in the separate panel directly corresponds to the candle's trading range, allowing you to easily spot periods of high or low volatility.
Customizable Color: Easily change the line color to match your chart's theme and personal preferences.
Actionable Insights: Use this indicator to confirm periods of market consolidation before a breakout or to gauge the strength of a trend based on the expansion of candle ranges.
开源脚本
秉承TradingView的精神,该脚本的作者将其开源,以便交易者可以查看和验证其功能。向作者致敬!您可以免费使用该脚本,但请记住,重新发布代码须遵守我们的网站规则。
免责声明
这些信息和出版物并非旨在提供,也不构成TradingView提供或认可的任何形式的财务、投资、交易或其他类型的建议或推荐。请阅读使用条款了解更多信息。
开源脚本
秉承TradingView的精神,该脚本的作者将其开源,以便交易者可以查看和验证其功能。向作者致敬!您可以免费使用该脚本,但请记住,重新发布代码须遵守我们的网站规则。
免责声明
这些信息和出版物并非旨在提供,也不构成TradingView提供或认可的任何形式的财务、投资、交易或其他类型的建议或推荐。请阅读使用条款了解更多信息。