PROTECTED SOURCE SCRIPT
Whole Number Levels & Zones
Whole Number Levels & Zones Indicator
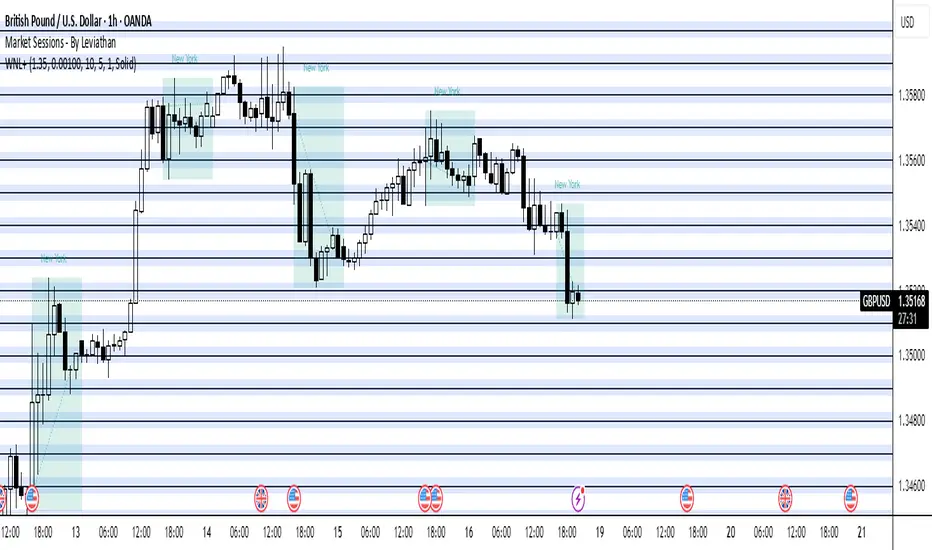
This indicator is designed to automatically plot key psychological price levels on your chart. These are typically round numbers (e.g., 1.35000 on GBP/USD) where trading activity often clusters, creating potential support and resistance.
How It's Used:
Traders use these lines and zones to identify areas where the price might pause, reverse, or break out.
Support: If the price is falling, it may find support and bounce off one of these levels.
Resistance: If the price is rising, it may face resistance and stall at one of these levels.
Confirmation: It can be used alongside other indicators and analysis techniques to confirm trade entries or exits.
Key Features:
Automatic or Manual Levels: You can either let the indicator automatically adjust the lines based on the current price or anchor them to a specific starting price you choose.
Customizable Intervals: You can set the distance between each line (e.g., every 50 or 100 pips).
Shaded Zones: You can enable a shaded box around each line to better visualize the price zones. The height of this box is adjustable.
Full Styling Control: You have complete control over the color, style (dashed, solid, dotted), and thickness of the lines and zones to match your chart's theme.
受保护脚本
此脚本以闭源形式发布。 但是,您可以自由使用,没有任何限制 — 了解更多信息这里。
免责声明
这些信息和出版物并非旨在提供,也不构成TradingView提供或认可的任何形式的财务、投资、交易或其他类型的建议或推荐。请阅读使用条款了解更多信息。
免责声明
这些信息和出版物并非旨在提供,也不构成TradingView提供或认可的任何形式的财务、投资、交易或其他类型的建议或推荐。请阅读使用条款了解更多信息。