OPEN-SOURCE SCRIPT
All Weekly Opens + Week Label
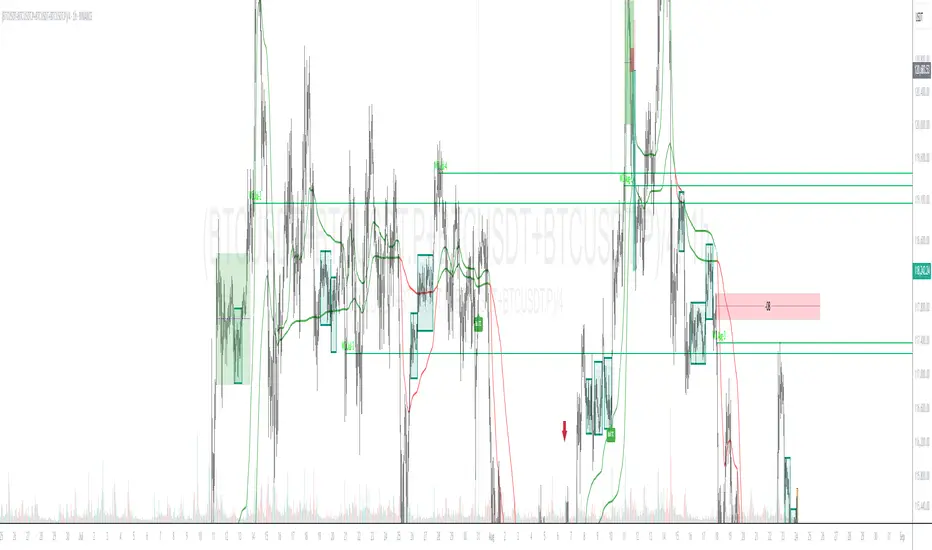
This script plots every Weekly Open (WO) across the entire chart, making it easy for traders to backtest how price reacts to weekly opens historically.
Each weekly open is drawn as a horizontal line and labeled with the month abbreviation and the week number of that month (e.g., WO Aug-4). This allows traders to quickly identify where each weekly session started and analyze market behavior around these key reference levels.
How it works
The script detects the first bar of each new week and records its opening price.
A horizontal line is drawn at that price, extending to the right.
An optional label shows the week name in the format Month-WeekNumber.
Traders can enable or disable labels, change line colors, line width, and optionally display the opening price in the label.
A new input allows filtering to show only the last N months of Weekly Opens. By default, all weekly opens are displayed, but traders can limit the chart to just the most recent ones for a cleaner view.
Why it’s useful
Weekly opens are often respected levels in both intraday and swing trading. They provide natural reference points for:
Backtesting market reactions to session opens.
Identifying areas of support/resistance around weekly levels.
Aligning trade entries and exits with higher-timeframe context.
Simplifying charts by focusing only on the most relevant recent weeks.
Notes
This indicator is not a trading signal generator.
It should be used as a contextual tool for analysis, helping traders improve risk management and entry precision.
Works on all symbols and timeframes.
The “last N months” filter is optional; setting it to 0 will plot all Weekly Opens available in the chart’s history.
开源脚本
秉承TradingView的精神,该脚本的作者将其开源,以便交易者可以查看和验证其功能。向作者致敬!您可以免费使用该脚本,但请记住,重新发布代码须遵守我们的网站规则。
免责声明
这些信息和出版物并非旨在提供,也不构成TradingView提供或认可的任何形式的财务、投资、交易或其他类型的建议或推荐。请阅读使用条款了解更多信息。
免责声明
这些信息和出版物并非旨在提供,也不构成TradingView提供或认可的任何形式的财务、投资、交易或其他类型的建议或推荐。请阅读使用条款了解更多信息。