PROTECTED SOURCE SCRIPT
Candle Range in Ticks / Pips
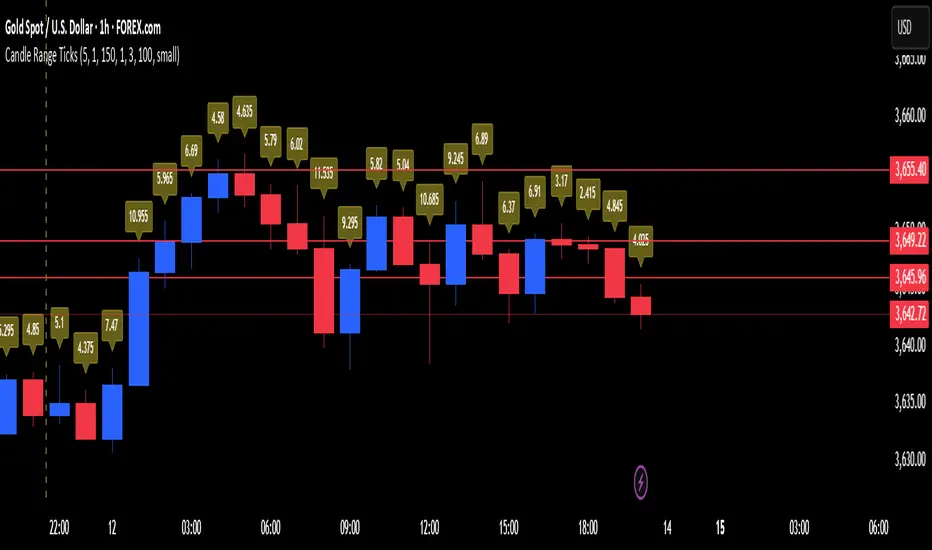
This indicator displays the size (range) of each candle in ticks, pips, or points. Labels are drawn above or below each candle with full customization, so you can quickly spot volatility shifts and unusual ranges.
Features:
- Show candle ranges for the last days (configurable)
- Custom point-to-tick/pip ratio for different markets (Forex, Futures, Indices, Crypto)
- Choose label size, color, and placement (above or below candles)
- Control how dense labels are with an “every Nth candle” option
- Built-in safeguard with a max label limit to keep charts smooth
Use cases:
- Quickly measure and compare candle ranges across sessions or days
- Spot unusually large or small candles relative to recent activity
- Analyze volatility in ticks/pips without switching to a separate tool
受保护脚本
此脚本以闭源形式发布。 但是,您可以自由使用,没有任何限制 — 了解更多信息这里。
免责声明
这些信息和出版物并非旨在提供,也不构成TradingView提供或认可的任何形式的财务、投资、交易或其他类型的建议或推荐。请阅读使用条款了解更多信息。
受保护脚本
此脚本以闭源形式发布。 但是,您可以自由使用,没有任何限制 — 了解更多信息这里。
免责声明
这些信息和出版物并非旨在提供,也不构成TradingView提供或认可的任何形式的财务、投资、交易或其他类型的建议或推荐。请阅读使用条款了解更多信息。