PINE LIBRARY
Material Color Palette Library
█ OVERVIEW
Unlock a world of color in your Pine Script® projects with the Material Color Palette Library. This library provides a comprehensive and structured color system based on Google's Material Design palette, making it incredibly easy to create visually appealing and professional-looking indicators and strategies.
Forget about guessing hex codes. With this library, you have access to 19 distinct color families, each offering a wide range of shades. Every color can be fine-tuned with saturation, darkness, and opacity levels, giving you precise control over your script's appearance.
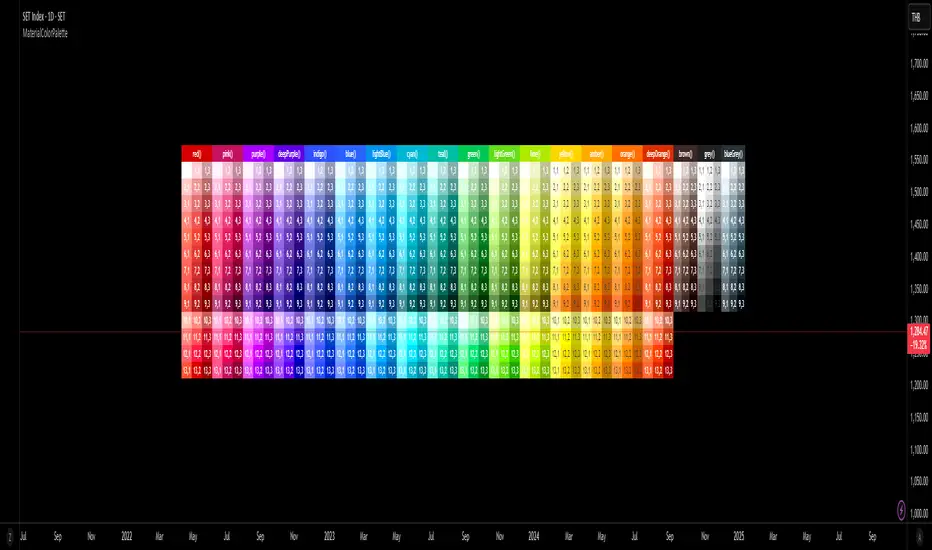
To make development even easier, the library includes a visual cheatsheet. Simply add the script to your chart to display a full table of all available colors and their corresponding parameters.
█ KEY FEATURES
█ HOW TO USE
As a library, this script is meant to be imported into your own indicators or strategies.
1. Import the Library
Add the following line to the top of your script. Remember to replace `YourUsername` with your TradingView username.
Pine Script®
2. Call a Color Function
You can now use any of the exported functions to set colors for your plots, backgrounds, tables, and more.
The primary functions take three arguments: `functionName(saturationLevel, darkLevel, opacity)`
Example Usage:
Let's plot a moving average with a specific shade of teal.
Pine Script®
3. Using the `tone()` Function
For quick access to a base color, you can use the `tone()` function.
Pine Script®
█ VISUAL REFERENCE
To see all available colors at a glance, you can add this library script directly to your chart. It will display a comprehensive table showing every color variant. This makes it easy to pick the exact shade you need without guesswork.
This library is designed for fellow Pine Script® developers to streamline their workflow and enhance the visual quality of their scripts. Enjoy!
Unlock a world of color in your Pine Script® projects with the Material Color Palette Library. This library provides a comprehensive and structured color system based on Google's Material Design palette, making it incredibly easy to create visually appealing and professional-looking indicators and strategies.
Forget about guessing hex codes. With this library, you have access to 19 distinct color families, each offering a wide range of shades. Every color can be fine-tuned with saturation, darkness, and opacity levels, giving you precise control over your script's appearance.
To make development even easier, the library includes a visual cheatsheet. Simply add the script to your chart to display a full table of all available colors and their corresponding parameters.
█ KEY FEATURES
- Vast Spectrum: 19 distinct color families, from vibrant reds and blues to subtle greys and browns.
- Fine-Tuned Control: Each color function accepts parameters for `saturationLevel` (1-13 or 1-9) and `darkLevel` (1-3) to select the perfect shade.
- Opacity Parameter: Easily add transparency to any color for fills, backgrounds, or lines.
- Quick Access Tones: A simple `tone()` function to grab base colors by name.
- Visual Cheatsheet: An on-chart table displays the entire color palette, serving as a handy reference guide during development.
█ HOW TO USE
As a library, this script is meant to be imported into your own indicators or strategies.
1. Import the Library
Add the following line to the top of your script. Remember to replace `YourUsername` with your TradingView username.
import mastertop/ColorPalette/1 as colors
2. Call a Color Function
You can now use any of the exported functions to set colors for your plots, backgrounds, tables, and more.
The primary functions take three arguments: `functionName(saturationLevel, darkLevel, opacity)`
- `saturationLevel`: An integer that controls the intensity of the color. Ranges from 1 (lightest) to 13 (most vibrant) for most colors, and 1-9 for `brown`, `grey`, and `blueGrey`.
- `darkLevel`: An integer from 1 to 3 (1: light, 2: medium, 3: dark).
- `opacity`: An integer from 0 (opaque) to 100 (invisible).
Example Usage:
Let's plot a moving average with a specific shade of teal.
// Import the library
import mastertop/ColorPalette/1 as colors
indicator("My Script with Custom Colors", overlay = true)
// Calculate a moving average
ma = ta.sma(close, 20)
// Plot the MA using a color from the library
// We'll use teal with saturation level 7, dark level 2, and 0% opacity
plot(ma, "MA", color = colors.teal(7, 2, 0), linewidth = 2)
3. Using the `tone()` Function
For quick access to a base color, you can use the `tone()` function.
// Set a red background with 85% transparency
bgcolor(colors.tone('red', 85))
█ VISUAL REFERENCE
To see all available colors at a glance, you can add this library script directly to your chart. It will display a comprehensive table showing every color variant. This makes it easy to pick the exact shade you need without guesswork.
This library is designed for fellow Pine Script® developers to streamline their workflow and enhance the visual quality of their scripts. Enjoy!
Pine脚本库
秉承TradingView的精神,作者已将此Pine代码作为开源库发布,以便我们社区的其他Pine程序员可以重用它。向作者致敬!您可以私下或在其他开源出版物中使用此库,但在出版物中重用此代码须遵守网站规则。
mastertop
免责声明
这些信息和出版物并非旨在提供,也不构成TradingView提供或认可的任何形式的财务、投资、交易或其他类型的建议或推荐。请阅读使用条款了解更多信息。
Pine脚本库
秉承TradingView的精神,作者已将此Pine代码作为开源库发布,以便我们社区的其他Pine程序员可以重用它。向作者致敬!您可以私下或在其他开源出版物中使用此库,但在出版物中重用此代码须遵守网站规则。
mastertop
免责声明
这些信息和出版物并非旨在提供,也不构成TradingView提供或认可的任何形式的财务、投资、交易或其他类型的建议或推荐。请阅读使用条款了解更多信息。