OPEN-SOURCE SCRIPT
Horizontal lines by Aydmaxx
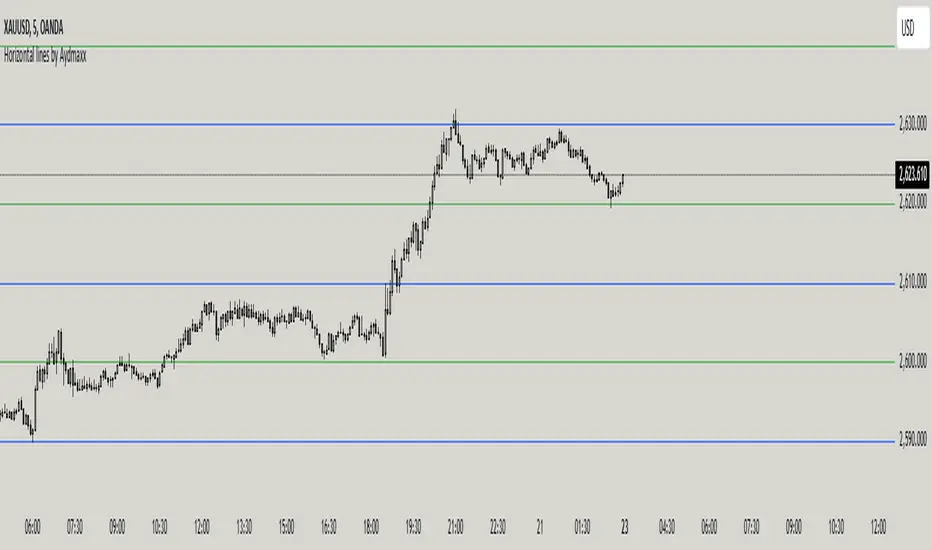
Indicator Description: Horizontal Lines by Aydmaxx
This indicator plots customizable horizontal lines on the chart to assist with technical analysis. It allows traders to define a starting price and a step size (gap) between the lines, making it versatile for a variety of strategies, such as identifying support, resistance, or key price levels.
How to Use:
Starting Price (Bottom): Enter the price level where the first (lowest) line should begin. This is your base level.
Example: If you're analyzing a market with prices around 2550, you can set this value to 2550 to align the indicator with your focus.
Gap (Step Size): Specify the interval or step size between consecutive lines.
Example: If you want lines every 10 points, set this value to 10.
Number of Lines: Adjust the total number of lines to display on the chart.
Line Style and Width: Customize the appearance of the lines (solid, dashed, dotted) and their thickness.
Line Colors and Transparency: Choose primary and secondary colors for alternating lines, and adjust the transparency to match your visual preferences.
This indicator is ideal for visualizing price zones and can be tailored to suit any trading style. Adjust the parameters based on your market analysis to highlight key price levels effectively.
开源脚本
秉承TradingView的精神,该脚本的作者将其开源,以便交易者可以查看和验证其功能。向作者致敬!您可以免费使用该脚本,但请记住,重新发布代码须遵守我们的网站规则。
免责声明
这些信息和出版物并非旨在提供,也不构成TradingView提供或认可的任何形式的财务、投资、交易或其他类型的建议或推荐。请阅读使用条款了解更多信息。
免责声明
这些信息和出版物并非旨在提供,也不构成TradingView提供或认可的任何形式的财务、投资、交易或其他类型的建议或推荐。请阅读使用条款了解更多信息。