OPEN-SOURCE SCRIPT
SHILLER_PE_RATIO_MONTH
DISCRIPTION
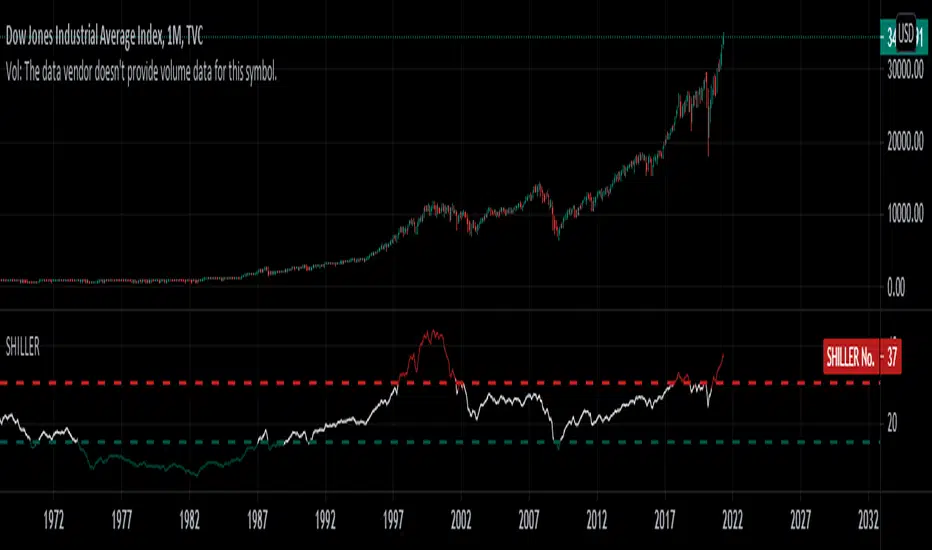
Shiller PE ratio for the S&P 500. Price earnings ratio is based on average inflation-adjusted earnings from the previous 10 years, known as the Cyclically Adjusted PE Ratio (CAPE Ratio)
TIME FRAME
1M
HOW TO USE
It provide historic Shiller PE which will provide over-bought or over-sold condition historically from 19th century.
MODIFICATION
When the pe ratio crosses 30 considered as Greed
When the pe ratio fall below 15 considered as Fear
开源脚本
秉承TradingView的精神,该脚本的作者将其开源,以便交易者可以查看和验证其功能。向作者致敬!您可以免费使用该脚本,但请记住,重新发布代码须遵守我们的网站规则。
免责声明
这些信息和出版物并非旨在提供,也不构成TradingView提供或认可的任何形式的财务、投资、交易或其他类型的建议或推荐。请阅读使用条款了解更多信息。
免责声明
这些信息和出版物并非旨在提供,也不构成TradingView提供或认可的任何形式的财务、投资、交易或其他类型的建议或推荐。请阅读使用条款了解更多信息。