INVITE-ONLY SCRIPT
(VIP) VSA Scanner v2
已更新
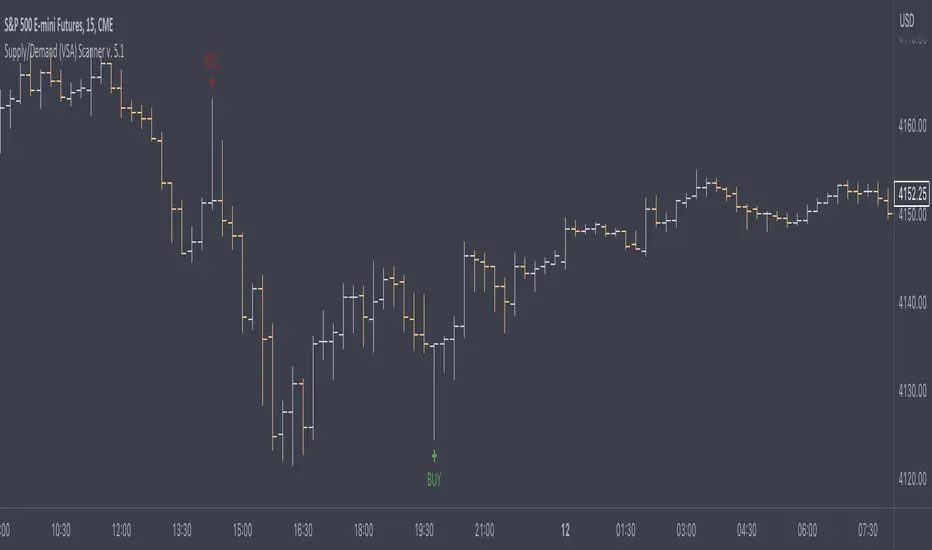
This script is major rewritten from scratch analysis of Volume Spread Analysis in comparison to previous version. New definitions have been added, calculations of Spread, Volume and Trend have been optimised and signals are much more accurate. I created script based on definitions coming from methodology of Volume Spread Analysis. Signals appearing below candle are treated as SOS (Signal of Strength) and those above candles - SOW (Signal of Weakness). Also we can see automatic identification of Bullish / Bearish Volume . Script is judging Spread and Volume used for identifying VSA Signals based on multiple factors. Also analysis of Effort & Result have been added, easily allowing to spot continuations of trend and divergences.
All major signals from VSA have been added like Stopping Volume, Climaxes, End of Rising Market, Bag Holding etc.
In case of interest, please contact me directly via DM on Tradingview or please see link to documentation from my signature where you can find more information about Subscription and script itself.
版本注释
Correction of adding missing in some definitions optional condition of minimum volume to perform analysis版本注释
- Corrected and updated definitions of signals accordingly to the most recent rules of VSA methodology
- Optimised performance of calculations
- Added new VSA Signals
- Bugfixes
版本注释
Corrected and rewritten mechanism of calculating volume average from last sessions defined via Inputs版本注释
Adjusted code to bug-fix for calculation Session Average Volume版本注释
- corrected few signals definition and classification in SOW
- adjusted alerts to reflect the newest bugfixes
版本注释
- new function - Volume-based S/R levels
- added display of EMA200
版本注释
- Added option to display auto-adaptive Hull Moving Average based on Range or Volume present on the market
版本注释
Corrected signals definitions from original VSA methodology.There are four categories of signals now marked as below:
- Cross and Diamond - major signals predicting possible trend reversal
- Circle - Signals of Weakness/Strength
- Triangle - Tests from VSA methodology
- Flag - is displaying signals when Supply/Demand Zone were broken
Ideal scenario would be to get firsty Cross or Diamond Signal, then Circle and Triangle - but it's not always happening. It's individual judgement of trader what makes a difference and can turn signals from VSA Scanner into profitable trade.
There are also drawn Supply (orange) and Demand Zones (blue).
Scanner is not displaying all Wyckoff's nor VSA signals in order to simplify things but I tried to reflect as much as possible in it - that's why we have also Strength and Weakness Signals or Confirmations being displayed on chart.
版本注释
Bugfix - restore original functionalities of Volume Zones & Auto-Adaptive Moving Average that disappeared (by mistake!) within previous update版本注释
Modified coloring of signals (in order of importance):Bullish - Green, Blue, Purple
Bearish - Red, Orange, Yellow
Also I've added logic to limit double signals per bars, introducing priority of signals policy and display more important signal per bar in case of multiple signals identified by algo
版本注释
Bugfixes版本注释
- corrected definitions of signals from VSA & Wyckoff methodology, improved accuracy
- added functionality of display Ultra Zones, extremely accurate in trading in case of retests/breakthroughs
版本注释
- Alerts added
- Adjusted signals accuracy, corrections in definitions
- Bugfixes
版本注释
- added alternative method of trend calculation (recommended and enabled by default)
- ultra volume zones are more accurate than even before! Now they're combined strictly with Climactic VSA Signals and Ultra high Volume Levels (you still have possibility to enable display of all volume zones based on vsa)
- alerts added
版本注释
- simplification of signals display - now it's either BUY or SELL in default mode
- code migration to Pine v5
版本注释
Fixed typos in code版本注释
Fixed issue with code compilation due to changes in Pine Script仅限邀请脚本
仅限作者授权的用户访问此脚本,并且通常需要付费。您可以将其添加到收藏中,但是只有在向作者请求并获得许可之后,才能使用它。 请联系skyline-trader了解更多信息,或按照以下作者的说明操作。
TradingView不建议付费使用脚本,除非您100%信任作者并了解脚本的工作原理。在许多情况下,您可以在我们的社区脚本免费找到不错的开源替代方案。
作者的说明
″Can be purchased via monthly subscription. DM me in case of interest in getting acccess to this indicator.
想在图表上使用此脚本?
警告:请在申请访问权限之前阅读。
免责声明
这些信息和出版物并不意味着也不构成TradingView提供或认可的金融、投资、交易或其它类型的建议或背书。请在使用条款阅读更多信息。