INVITE-ONLY SCRIPT
Bull Bear Trend Anlysis Signals by ActualEquation
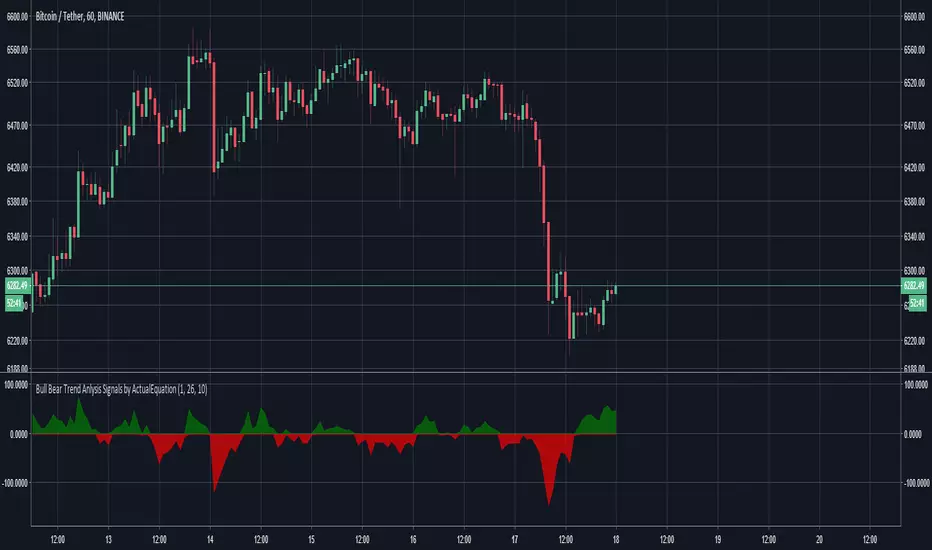
This indicator analyzes the trend utilizing MACD and other math algorithms to find confirmed entries and exits.
How To Use
Best used on TF larger than 1 hour for highest accuracy.
The higher the wave the stronger the trend.
For entries, wait for the wave to rise then enter after a color flip.
Once flipped, you can look for entries at a smaller time frame to narrow down your buy price.
For shorts, wait for confirmation of color flip with initial red wave down.
BOUNCE PLAYS:
1. Find Divergences via the height of the wave.
2. The more stretched from 0 the stronger the strength.
3. If second drop/rise is less than first, then divergence is present, look for entry.
4. Zoom in to the hourly charts to find initial bounces, then zoom into 5 minutes to look for setups.
NOTE: all signals strength are based off the charts macro strength and most are delayed. If the signal is too high, then it should be the time to close position soon.
仅限邀请脚本
只有作者授权的用户才能访问此脚本。您需要申请并获得使用许可。通常情况下,付款后即可获得许可。更多详情,请按照下方作者的说明操作,或直接联系ChaiQixuan。
TradingView不建议您付费购买或使用任何脚本,除非您完全信任其作者并了解其工作原理。您也可以在我们的社区脚本找到免费的开源替代方案。
作者的说明
免责声明
这些信息和出版物并非旨在提供,也不构成TradingView提供或认可的任何形式的财务、投资、交易或其他类型的建议或推荐。请阅读使用条款了解更多信息。
仅限邀请脚本
只有作者授权的用户才能访问此脚本。您需要申请并获得使用许可。通常情况下,付款后即可获得许可。更多详情,请按照下方作者的说明操作,或直接联系ChaiQixuan。
TradingView不建议您付费购买或使用任何脚本,除非您完全信任其作者并了解其工作原理。您也可以在我们的社区脚本找到免费的开源替代方案。
作者的说明
免责声明
这些信息和出版物并非旨在提供,也不构成TradingView提供或认可的任何形式的财务、投资、交易或其他类型的建议或推荐。请阅读使用条款了解更多信息。