OPEN-SOURCE SCRIPT
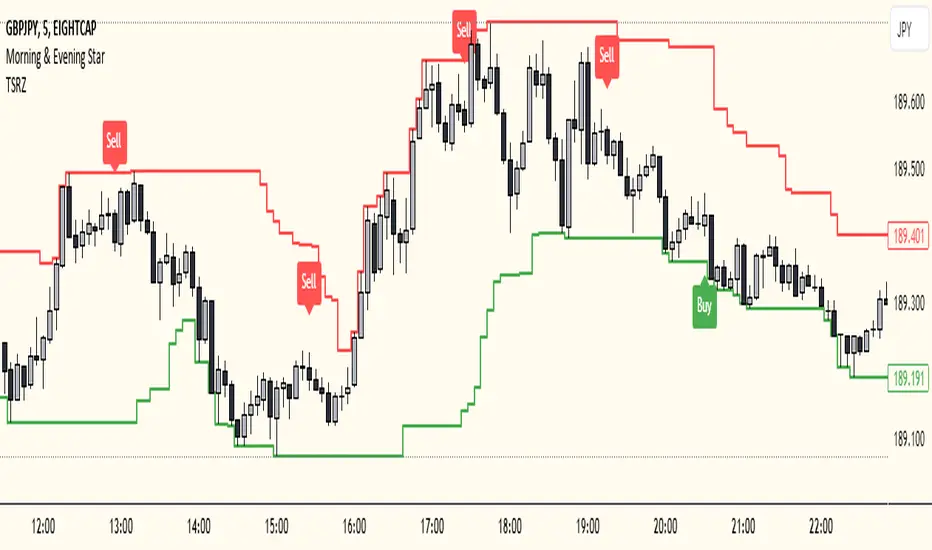
Trailing Support and Resistance Zones
This Script code is used to plot support and resistance levels on a chart. Here's how it works:
Input Parameters: The code starts by defining an input parameter lookback_period, which determines the number of bars to look back when calculating support and resistance levels. You can adjust this parameter based on your preferences or trading strategy. I recommend 50 for longer trends and larger profits.
Calculate Support and Resistance Levels: The calculateSR() function is defined to calculate the support and resistance levels based on the lowest low and highest high prices within the specified lookback period. It uses the ta.lowest() function to find the lowest low price and the ta.highest() function to find the highest high price over the specified number of bars.
Plotting: The function calculateSR() is called to compute the support and resistance levels, and the results are stored in the variables support_level and resistance_level, respectively. These levels are then plotted on the chart using the plot() function. The support levels are plotted in green, while the resistance levels are plotted in red. Both lines are drawn with a specified line width and style (plot.style_stepline).
By visualizing these support and resistance levels on the chart, you can identify potential price levels where the market might find buying or selling pressure. These levels are crucial for making trading decisions, such as setting entry and exit points, defining stop-loss and take-profit levels, and assessing the overall market sentiment.
I recommend using this indicator together with my morning & Evening Star Indicator to find entry zones.
开源脚本
秉承TradingView的精神,该脚本的作者将其开源,以便交易者可以查看和验证其功能。向作者致敬!您可以免费使用该脚本,但请记住,重新发布代码须遵守我们的网站规则。
免责声明
这些信息和出版物并非旨在提供,也不构成TradingView提供或认可的任何形式的财务、投资、交易或其他类型的建议或推荐。请阅读使用条款了解更多信息。
开源脚本
秉承TradingView的精神,该脚本的作者将其开源,以便交易者可以查看和验证其功能。向作者致敬!您可以免费使用该脚本,但请记住,重新发布代码须遵守我们的网站规则。
免责声明
这些信息和出版物并非旨在提供,也不构成TradingView提供或认可的任何形式的财务、投资、交易或其他类型的建议或推荐。请阅读使用条款了解更多信息。