INVITE-ONLY SCRIPT
已更新 Crude Oil Indicator [SIDD]
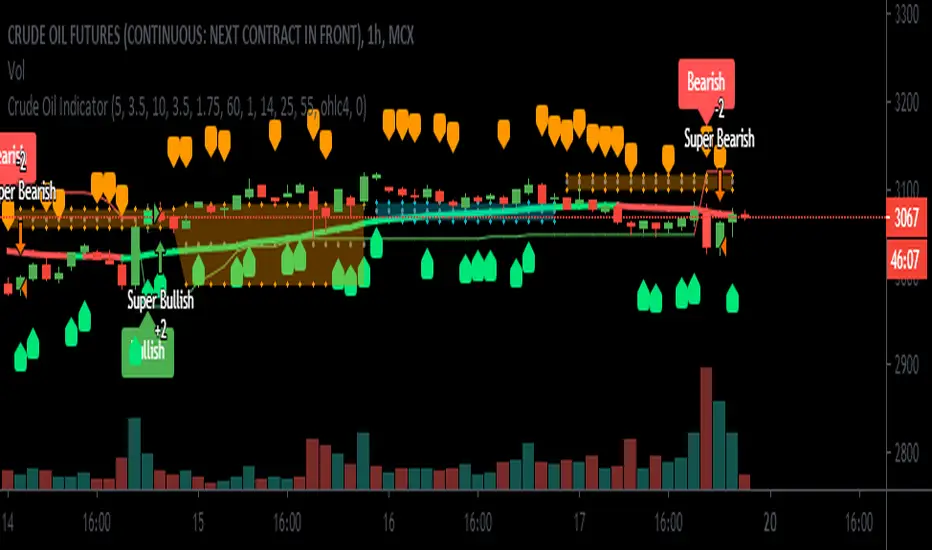
Crude Oil Indicator is giving two signal Bullish and Bearish . Bullish signal is used to take long trade and Bearish signal is used to close existing long trade and take new short trade and so on.
To get More signal of Bullish and Bearish user must enable More Signals check box that will check crossover and cross down of price close with Gaps.
I am using 2 ATR and one ADX and Gaps and VWMA to make signal profitable with 15 minutes 1 hr ,2hr,3hr,4hr chart time frame.
I have checked last few years data for back testing. Based on past performance it doesn't work well in 30 minute and 1 day chart time frame as results are not good in back testing. I have designed this indicator for Indian crude oil context though it can be used with other market as well.
1st ATR used to find trend with price crossover.
2nd ATR ADX is used to find the trend change details only. I have taken VWMA and ATR both to consider trend change.
Highlight Gap Up and Gap Down is used to know daily market opening gap up and gap down area. Gaps act as support and resistance .
VWMA Plotted as Blue line. Rising VWMA considered as uptrend and falling VWMA considered as downtrend.
Flat VWMA considered as no trend zone. In no trend zone every second third candles cross VWMA .
User must keep the default setting for getting better results as results are back tested. If setting changed then result may vary.
I have added here back tested performance user can see those results. I have added commission and slippage as well. Past year performance not guarantee for future years result so before taking any trade trader must take conscious decision.
This indicator is available on Subscription.
PM/ DM for more information about the script access.
Use the link below to obtain access to this indicator.
版本注释
Updated VWMA line color based on trend.Today checked with Gold and Natural Gas its working on that as well in positional trades.
版本注释
Added more signals with VWMA.Removed extra codes which are not useful.
版本注释
Added signals for consecutive candles based on open close so trend break can be identified.仅限邀请脚本
只有作者授权的用户才能访问此脚本。您需要申请并获得使用许可。通常情况下,付款后即可获得许可。更多详情,请按照下方作者的说明操作,或直接联系bullsbearsclub。
TradingView不建议您付费购买或使用任何脚本,除非您完全信任其作者并了解其工作原理。您也可以在我们的社区脚本找到免费的开源替代方案。
作者的说明
Join my Educational Telegram channel:
t.me/bullsbearsclub
My YouTube channel: youtube.com/channel/UC537A
My Indicator details:
docs.google.com/document/d/17wUSbSJEZR6rTNVdwqLEBaKM-CSYx-61TN0qazvsnAQ/edit?usp=sharing
t.me/bullsbearsclub
My YouTube channel: youtube.com/channel/UC537A
My Indicator details:
docs.google.com/document/d/17wUSbSJEZR6rTNVdwqLEBaKM-CSYx-61TN0qazvsnAQ/edit?usp=sharing
免责声明
这些信息和出版物并非旨在提供,也不构成TradingView提供或认可的任何形式的财务、投资、交易或其他类型的建议或推荐。请阅读使用条款了解更多信息。
仅限邀请脚本
只有作者授权的用户才能访问此脚本。您需要申请并获得使用许可。通常情况下,付款后即可获得许可。更多详情,请按照下方作者的说明操作,或直接联系bullsbearsclub。
TradingView不建议您付费购买或使用任何脚本,除非您完全信任其作者并了解其工作原理。您也可以在我们的社区脚本找到免费的开源替代方案。
作者的说明
Join my Educational Telegram channel:
t.me/bullsbearsclub
My YouTube channel: youtube.com/channel/UC537A
My Indicator details:
docs.google.com/document/d/17wUSbSJEZR6rTNVdwqLEBaKM-CSYx-61TN0qazvsnAQ/edit?usp=sharing
t.me/bullsbearsclub
My YouTube channel: youtube.com/channel/UC537A
My Indicator details:
docs.google.com/document/d/17wUSbSJEZR6rTNVdwqLEBaKM-CSYx-61TN0qazvsnAQ/edit?usp=sharing
免责声明
这些信息和出版物并非旨在提供,也不构成TradingView提供或认可的任何形式的财务、投资、交易或其他类型的建议或推荐。请阅读使用条款了解更多信息。