OPEN-SOURCE SCRIPT
已更新 trend judgment & multi ma
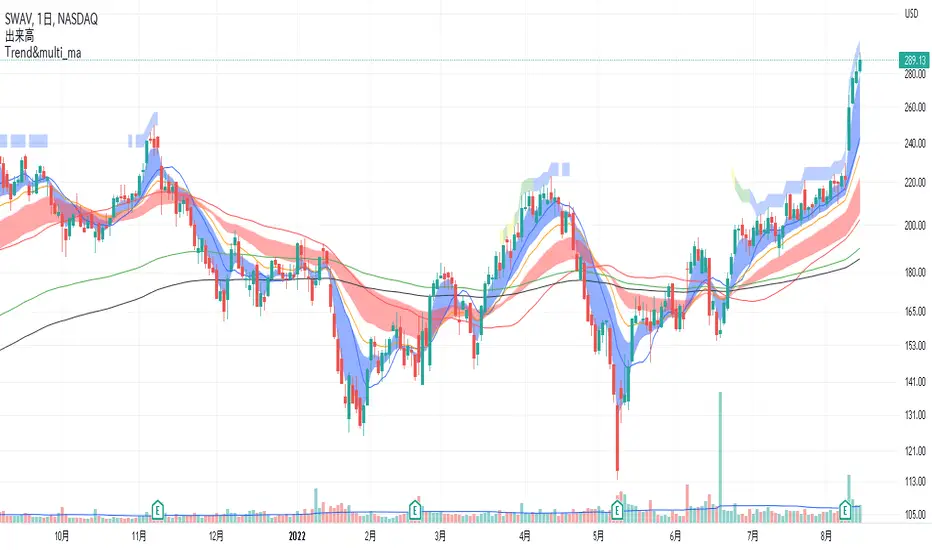
1 The background is filled with the number of matches to the trend template.
For the following conditions, 7 matches are yellow, 8 matches are green, and 9 matches are blue.
1. the stock price is above the 150-day MA and 200-day MA
2. the 50-day MA is above the 200-day MA
3. 200-day MA is in an uptrend for at least one month
4. 50-day MA is above 150-day MA and 200-day MA
5. stock price is 25% or more above 52-week low
6. stock price is 0 - 25% below 52-week high
7. IBD RS is above 70, preferably in the 90s → I don't know the exact formula, so I'm approximating with a formula that gives similar values.
8. when the stock is breaking above the base, the stock price is above the 50MA → It is difficult to judge the base itself, so it is not included in the conditions.
9. volume is high during an upward and low during a downward → volume during an upward > volume during a downward in the past 20 periods.
ex1. the 5-day MA is above the 20-day MA.
2 multi moving averages are shown.
版本注释
1 The background is filled with the number of matches to the trend template.For the following conditions, 7 matches are yellow, 8 matches are green, and 9 matches are blue.
1. the stock price is above the 150-day MA and 200-day MA
2. the 150-day MA is above the 200-day MA
3. 200-day MA is in an uptrend for at least one month
4. 50-day MA is above 150-day MA and 200-day MA
5. stock price is 25% or more above 52-week low
6. stock price is 0 - 25% below 52-week high
7. IBD RS is above 70, preferably in the 90s → I don't know the exact formula, so I'm approximating with a formula that gives similar values.
8. when the stock is breaking above the base, the stock price is above the 50MA → It is difficult to judge the base itself, so it is not included in the conditions.
9. volume is high during an upward and low during a downward → volume during an upward > volume during a downward in the past 20 periods.
ex1 . the 5-day MA is above the 20-day MA.
2 multi moving averages are shown.
开源脚本
秉承TradingView的精神,该脚本的作者将其开源,以便交易者可以查看和验证其功能。向作者致敬!您可以免费使用该脚本,但请记住,重新发布代码须遵守我们的网站规则。
免责声明
这些信息和出版物并非旨在提供,也不构成TradingView提供或认可的任何形式的财务、投资、交易或其他类型的建议或推荐。请阅读使用条款了解更多信息。
免责声明
这些信息和出版物并非旨在提供,也不构成TradingView提供或认可的任何形式的财务、投资、交易或其他类型的建议或推荐。请阅读使用条款了解更多信息。