OPEN-SOURCE SCRIPT
MVRV Altcoins
📌 Technical Description of Indicator: MVRV Altcoins
This advanced script calculates the Market Value to Realized Value (MVRV) ratio across multiple cryptocurrencies simultaneously. It offers two analytical modes: Normal and Z-Score, optimized for visual comparison and real-time monitoring of up to 13 predefined assets. If a user applies the indicator to a symbol that is not among the 13 programmed assets, the default behavior displays the Bitcoin chart as a fallback reference.
🔍 What Is MVRV and Why Is It Important?
MVRV is an on-chain metric designed to assess whether a cryptocurrency is overvalued or undervalued by comparing its market capitalization to its realized capitalization.
- Market Cap: The total circulating supply multiplied by the current market price.
- Realized Cap: The sum value of all coins based on the price at the time they last moved on-chain, offering a time-weighted valuation.
Normal Calculation:
MVRV_Normal = Market Cap / Realized Cap
This version reflects investor profitability and identifies potential accumulation or distribution zones.
📊 Z-Score Calculation:
MVRV_ZScore = (Market Cap − Realized Cap) / Standard Deviation of Market Cap
This formula evaluates how extreme the current market conditions are compared to historical norms. It normalizes the difference using statistical dispersion, turning it into a volatility-aware metric that better reflects valuation extremes.
🔎 How Market Cap Is Computed
Unlike conventional indicators relying on consolidated feeds, this script uses modular components from CoinMetrics to construct the active capitalization more accurately, especially for altcoins. Here's the breakdown:
Active Capitalization = MARKETCAPFF + MARKETCAPACTSPLY
Realized Capitalization = MARKETCAPREAL
Component Definitions:
- MARKETCAPFF: Market Cap Free Float — total valuation based only on truly circulating coins.
- MARKETCAPACTSPLY: Capitalization from actively circulating supply — filters dormant or locked coins.
- MARKETCAPREAL: Realized Cap — historical valuation weighted by the last on-chain movement of each coin.
This method offers enhanced precision and compatibility across assets that may lack comprehensive data from centralized providers.
⚙️ User-Configurable Parameters
- MVRV Mode: Choose between Normal and Z-Score.
- Percentage Scale View: If enabled, visual output is scaled using predefined divisors (100 / 3.5 or 100 / 6).
- Thresholds for Analysis:
- Normal mode: Define overbought and oversold levels (default 1.0 and 3.5).
- Z-Score mode: Configure statistical boundaries (default 0.0 and 6.0).
- Table Controls:
- Adjustable position on screen (9 options).
- Font size customization: tiny, small, normal, large.
- Color scheme personalization:
- Header: text and background
- Body: text and background
- Central column separator color
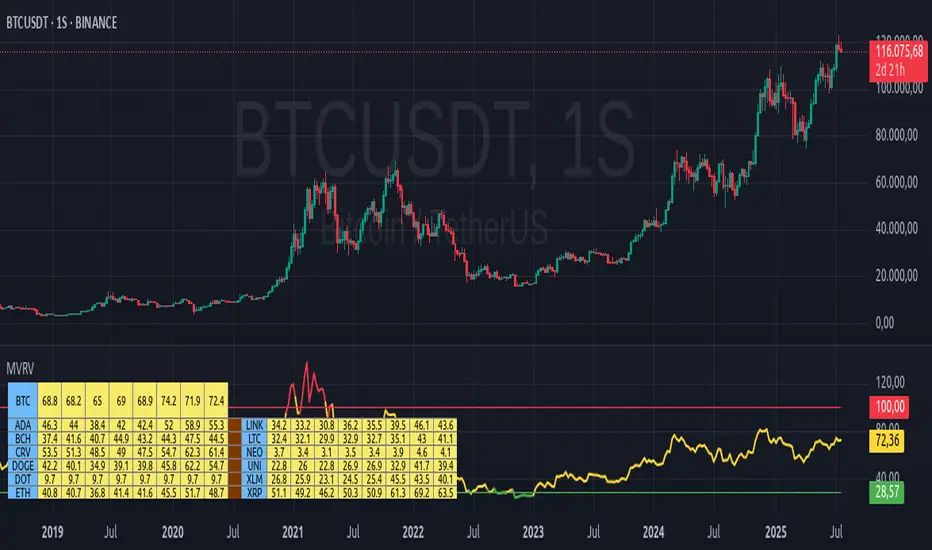
📊 Multicrypto Table Architecture
The indicator renders a high-performance visual table displaying data from up to 13 assets simultaneously. Each asset is represented as a vertical column featuring eigth historical data points plus the most recent value.
- Assets are displayed in two blocks separated by a decorative column.
- Each value is rounded to one decimal place for clarity.
- Cells are styled dynamically based on user settings.
🎨 Decorative Column Separator
Since the entire table is built as a unified structure, a color-configurable empty column is inserted mid-table to act as a visual divider. This approach improves readability and aesthetic balance without duplicating code or splitting table logic.
🔁 Default Behavior on Unsupported Assets
If the active chart is not one of the 13 predefined assets, the indicator will automatically display Bitcoin’s data. This ensures the chart remains functional and informative even outside the target asset group.
🎯 Color Interpretation by Condition
The MVRV value for each asset is highlighted using a traffic light system:
- Green: Undervalued (below oversold threshold)
- Red: Overvalued (above overbought threshold)
- Yellow: Neutral zone
This coding simplifies decision-making and visual scanning across assets.
Final Notes
This indicator is modular and fully adaptable, with well-commented sections designed for efficient customization. Its multiactive architecture makes it a valuable tool for crypto analysts tracking diversified portfolios beyond Bitcoin and Ethereum.
It supports visual storytelling across assets, comparative historical evaluation, and identification of strategic zones — whether for accumulation, distribution, or monitoring on-chain sentiment.
This advanced script calculates the Market Value to Realized Value (MVRV) ratio across multiple cryptocurrencies simultaneously. It offers two analytical modes: Normal and Z-Score, optimized for visual comparison and real-time monitoring of up to 13 predefined assets. If a user applies the indicator to a symbol that is not among the 13 programmed assets, the default behavior displays the Bitcoin chart as a fallback reference.
🔍 What Is MVRV and Why Is It Important?
MVRV is an on-chain metric designed to assess whether a cryptocurrency is overvalued or undervalued by comparing its market capitalization to its realized capitalization.
- Market Cap: The total circulating supply multiplied by the current market price.
- Realized Cap: The sum value of all coins based on the price at the time they last moved on-chain, offering a time-weighted valuation.
Normal Calculation:
MVRV_Normal = Market Cap / Realized Cap
This version reflects investor profitability and identifies potential accumulation or distribution zones.
📊 Z-Score Calculation:
MVRV_ZScore = (Market Cap − Realized Cap) / Standard Deviation of Market Cap
This formula evaluates how extreme the current market conditions are compared to historical norms. It normalizes the difference using statistical dispersion, turning it into a volatility-aware metric that better reflects valuation extremes.
🔎 How Market Cap Is Computed
Unlike conventional indicators relying on consolidated feeds, this script uses modular components from CoinMetrics to construct the active capitalization more accurately, especially for altcoins. Here's the breakdown:
Active Capitalization = MARKETCAPFF + MARKETCAPACTSPLY
Realized Capitalization = MARKETCAPREAL
Component Definitions:
- MARKETCAPFF: Market Cap Free Float — total valuation based only on truly circulating coins.
- MARKETCAPACTSPLY: Capitalization from actively circulating supply — filters dormant or locked coins.
- MARKETCAPREAL: Realized Cap — historical valuation weighted by the last on-chain movement of each coin.
This method offers enhanced precision and compatibility across assets that may lack comprehensive data from centralized providers.
⚙️ User-Configurable Parameters
- MVRV Mode: Choose between Normal and Z-Score.
- Percentage Scale View: If enabled, visual output is scaled using predefined divisors (100 / 3.5 or 100 / 6).
- Thresholds for Analysis:
- Normal mode: Define overbought and oversold levels (default 1.0 and 3.5).
- Z-Score mode: Configure statistical boundaries (default 0.0 and 6.0).
- Table Controls:
- Adjustable position on screen (9 options).
- Font size customization: tiny, small, normal, large.
- Color scheme personalization:
- Header: text and background
- Body: text and background
- Central column separator color
📊 Multicrypto Table Architecture
The indicator renders a high-performance visual table displaying data from up to 13 assets simultaneously. Each asset is represented as a vertical column featuring eigth historical data points plus the most recent value.
- Assets are displayed in two blocks separated by a decorative column.
- Each value is rounded to one decimal place for clarity.
- Cells are styled dynamically based on user settings.
🎨 Decorative Column Separator
Since the entire table is built as a unified structure, a color-configurable empty column is inserted mid-table to act as a visual divider. This approach improves readability and aesthetic balance without duplicating code or splitting table logic.
🔁 Default Behavior on Unsupported Assets
If the active chart is not one of the 13 predefined assets, the indicator will automatically display Bitcoin’s data. This ensures the chart remains functional and informative even outside the target asset group.
🎯 Color Interpretation by Condition
The MVRV value for each asset is highlighted using a traffic light system:
- Green: Undervalued (below oversold threshold)
- Red: Overvalued (above overbought threshold)
- Yellow: Neutral zone
This coding simplifies decision-making and visual scanning across assets.
Final Notes
This indicator is modular and fully adaptable, with well-commented sections designed for efficient customization. Its multiactive architecture makes it a valuable tool for crypto analysts tracking diversified portfolios beyond Bitcoin and Ethereum.
It supports visual storytelling across assets, comparative historical evaluation, and identification of strategic zones — whether for accumulation, distribution, or monitoring on-chain sentiment.
开源脚本
秉承TradingView的精神,该脚本的作者将其开源,以便交易者可以查看和验证其功能。向作者致敬!您可以免费使用该脚本,但请记住,重新发布代码须遵守我们的网站规则。
免责声明
这些信息和出版物并非旨在提供,也不构成TradingView提供或认可的任何形式的财务、投资、交易或其他类型的建议或推荐。请阅读使用条款了解更多信息。
开源脚本
秉承TradingView的精神,该脚本的作者将其开源,以便交易者可以查看和验证其功能。向作者致敬!您可以免费使用该脚本,但请记住,重新发布代码须遵守我们的网站规则。
免责声明
这些信息和出版物并非旨在提供,也不构成TradingView提供或认可的任何形式的财务、投资、交易或其他类型的建议或推荐。请阅读使用条款了解更多信息。