PROTECTED SOURCE SCRIPT
US30 Trend Screener (TechnoBlooms)
Identify Index Trends Before the Move Starts.
The US30 Trend Screener is a powerful tool designed to help traders understand the internal dynamics of the Dow Jones Industrial Average (US30) by analyzing the trends of its weighted component stocks in real time.
📊 How It Works
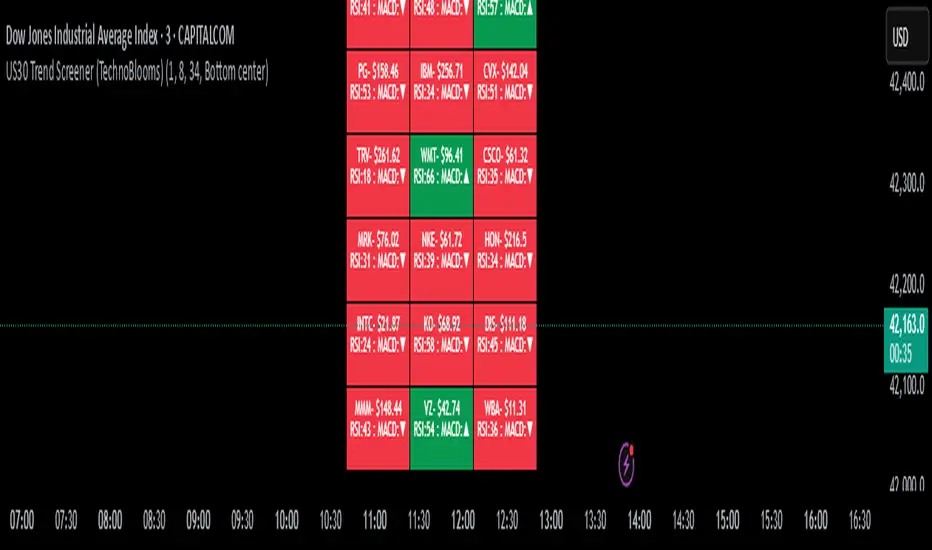
This indicator uses EMA crossovers, RSI, and MACD signals from the 30 Dow Jones stocks and visualizes them in a compact, color-coded dashboard overlay on your chart.
You can choose your preferred lower timeframe (e.g., 1min, 5min, 15min) to analyze intraday momentum before the US30 index reflects the shift.
⏱ Timeframe Input
Select any minute-based timeframe (1–240 min) to suit your trading strategy.
Each stock’s trend data is fetched using your selected timeframe, so you can zoom in or out on price action dynamics.
It is recommended to select the timeframe closer to the chart timeframe in the indicator.
🚀 Key Features
✅ Component-Based Analysis: Tracks all 30 Dow stocks like MSFT, AAPL, GS, etc., with real-time price and indicator updates.
✅ Trend Detection: Uses EMA (8/34) crossover to determine bullish or bearish trends per stock.


✅ Momentum Signals: Shows RSI (14) values and MACD direction (▲ / ▼) for each stock.
✅ Color-Coded Dashboard:
🟩 Green = Bullish trend
🟥 Red = Bearish trend
✅ Compact Display: See 30 stocks in a 3-column grid format, updated every few bars for performance.
🧠 Pro Tips
🔍 Use shorter timeframes (1–5 min) to detect early trend shifts—perfect for scalping and intraday entries.
💼 Watch high-weight stocks like GS, MSFT, UNH. A shift in their trend often precedes index movement.
🎯 Combine with price action or SMC tools to confirm institutional moves and breakouts.
🚦 If most of the dashboard turns green/red at once, it often signals a strong momentum breakout or reversal.
💡 Ideal For:
Index traders (US30/DJI futures or CFDs)
Scalpers & day traders
Momentum and trend-following strategies
Traders who want to see the story behind the index move
The US30 Trend Screener is a powerful tool designed to help traders understand the internal dynamics of the Dow Jones Industrial Average (US30) by analyzing the trends of its weighted component stocks in real time.
📊 How It Works
This indicator uses EMA crossovers, RSI, and MACD signals from the 30 Dow Jones stocks and visualizes them in a compact, color-coded dashboard overlay on your chart.
You can choose your preferred lower timeframe (e.g., 1min, 5min, 15min) to analyze intraday momentum before the US30 index reflects the shift.
⏱ Timeframe Input
Select any minute-based timeframe (1–240 min) to suit your trading strategy.
Each stock’s trend data is fetched using your selected timeframe, so you can zoom in or out on price action dynamics.
It is recommended to select the timeframe closer to the chart timeframe in the indicator.
🚀 Key Features
✅ Component-Based Analysis: Tracks all 30 Dow stocks like MSFT, AAPL, GS, etc., with real-time price and indicator updates.
✅ Trend Detection: Uses EMA (8/34) crossover to determine bullish or bearish trends per stock.
✅ Momentum Signals: Shows RSI (14) values and MACD direction (▲ / ▼) for each stock.
✅ Color-Coded Dashboard:
🟩 Green = Bullish trend
🟥 Red = Bearish trend
✅ Compact Display: See 30 stocks in a 3-column grid format, updated every few bars for performance.
🧠 Pro Tips
🔍 Use shorter timeframes (1–5 min) to detect early trend shifts—perfect for scalping and intraday entries.
💼 Watch high-weight stocks like GS, MSFT, UNH. A shift in their trend often precedes index movement.
🎯 Combine with price action or SMC tools to confirm institutional moves and breakouts.
🚦 If most of the dashboard turns green/red at once, it often signals a strong momentum breakout or reversal.
💡 Ideal For:
Index traders (US30/DJI futures or CFDs)
Scalpers & day traders
Momentum and trend-following strategies
Traders who want to see the story behind the index move
受保护脚本
此脚本以闭源形式发布。 但是,您可以自由使用它,没有任何限制 — 在此处了解更多信息。
免责声明
这些信息和出版物并不意味着也不构成TradingView提供或认可的金融、投资、交易或其它类型的建议或背书。请在使用条款阅读更多信息。
受保护脚本
此脚本以闭源形式发布。 但是,您可以自由使用它,没有任何限制 — 在此处了解更多信息。
免责声明
这些信息和出版物并不意味着也不构成TradingView提供或认可的金融、投资、交易或其它类型的建议或背书。请在使用条款阅读更多信息。