OPEN-SOURCE SCRIPT
SMA Multi Time Frame Table V1.5
Since I couldn't find a script like this I made one so here is what it does.
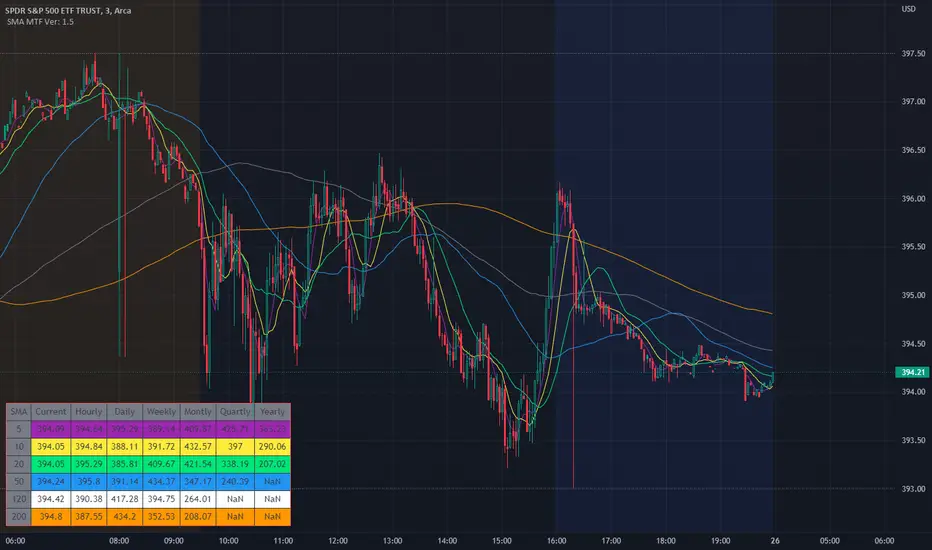
The script will plot on the chart as well as post the related data into the table.
The default Simple Moving Avg are 5, 10, 20, 50, 120, 200 which can also be changed to whatever SMA you would like. The SMA values are then plotted on the charts so that quickly check to see where they are and how the candles are reacting to the SMAs.
Not only does the script plot the SMAs but it also places higher time frames into the table that is in the script, from current price, to daily, weekly, monthly, quarterly (3 months if you don't have it added) and yearly. The reason why was it price action of the stock does interact and can be rejected or find support from SMA on a higher time frames.
I still use this script so that you can quickly capture the values so that short-term, and long-term resistance and support can be determined during market hours.
Another good thing is that when you change the values in the script settings it also applies those settings to the table as well.
Now it will take a little bit for the table to show up, so please be patient. I have tested it with stocks, forex, and crypto.
I wanted to get this published and I am still working on the background to try and get EMAs. Where you can flip over to EMA to also see the EMA plots and table values for the MTF.
开源脚本
秉承TradingView的精神,该脚本的作者将其开源,以便交易者可以查看和验证其功能。向作者致敬!您可以免费使用该脚本,但请记住,重新发布代码须遵守我们的网站规则。
免责声明
这些信息和出版物并非旨在提供,也不构成TradingView提供或认可的任何形式的财务、投资、交易或其他类型的建议或推荐。请阅读使用条款了解更多信息。
开源脚本
秉承TradingView的精神,该脚本的作者将其开源,以便交易者可以查看和验证其功能。向作者致敬!您可以免费使用该脚本,但请记住,重新发布代码须遵守我们的网站规则。
免责声明
这些信息和出版物并非旨在提供,也不构成TradingView提供或认可的任何形式的财务、投资、交易或其他类型的建议或推荐。请阅读使用条款了解更多信息。