OPEN-SOURCE SCRIPT
Breakout Score (0–100)
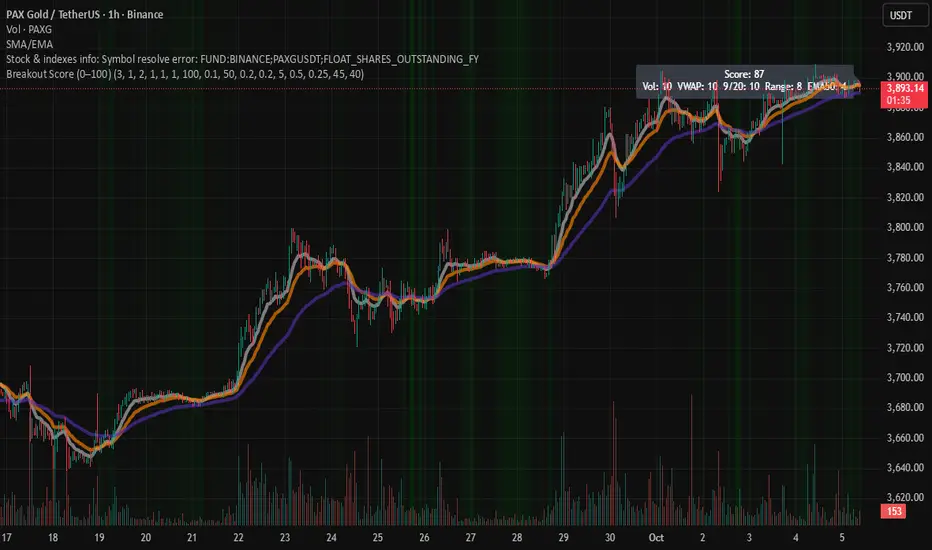
Breakouts are often the trader's best setups. Often seen on the chart as wedges and flags, consolidation before a pop up or down. This script attempts to visualize breakout potential with gradients in the background. I built this to place on my side charts to quickly visualize that a setup was forming.
For this indicator, Breakouts have generally been assumed as:
Decrease in average volume over N candles
Proximity to VWAP
Convergence/cross of price to the 9, 20 and 50 EMAs
Range compression (formation of flag or consolidation)
each of these factors are scored and rated. Multiple signals exponentially increase the gradient. Depending on the score, the chart will display a visual gradient behind the chart. Color, opacity and filtering fully customizable.
Enjoy!
开源脚本
秉承TradingView的精神,该脚本的作者将其开源,以便交易者可以查看和验证其功能。向作者致敬!您可以免费使用该脚本,但请记住,重新发布代码须遵守我们的网站规则。
免责声明
这些信息和出版物并非旨在提供,也不构成TradingView提供或认可的任何形式的财务、投资、交易或其他类型的建议或推荐。请阅读使用条款了解更多信息。
开源脚本
秉承TradingView的精神,该脚本的作者将其开源,以便交易者可以查看和验证其功能。向作者致敬!您可以免费使用该脚本,但请记住,重新发布代码须遵守我们的网站规则。
免责声明
这些信息和出版物并非旨在提供,也不构成TradingView提供或认可的任何形式的财务、投资、交易或其他类型的建议或推荐。请阅读使用条款了解更多信息。